
Suri Duddella reveals bullish chart patterns in Cloud Computing stocks.
During the Covid-19 pandemic, few sectors have performed well as many business operations around the world have halted. The Cloud Computing sector stocks have performed well in 2020 as people and businesses rely on their products and services. Cloud computing companies include Computing Software as service, platform as a service, infrastructure as a service along with storage space/data center computing infrastructure and hardware.
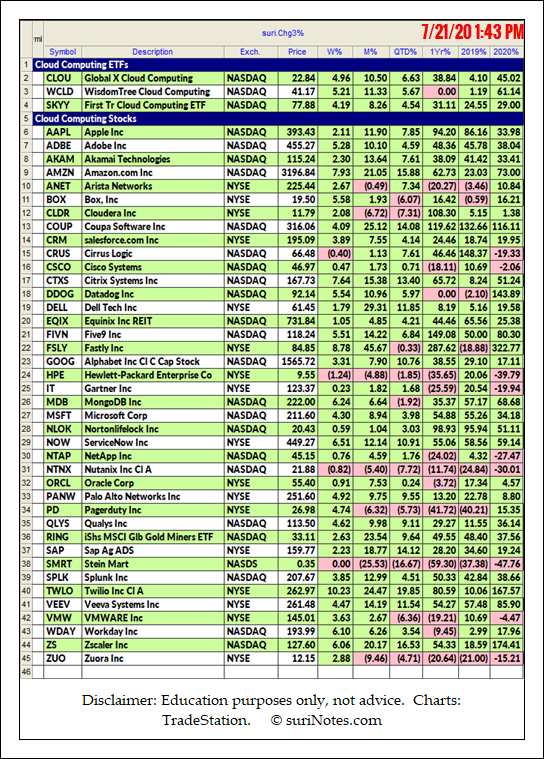
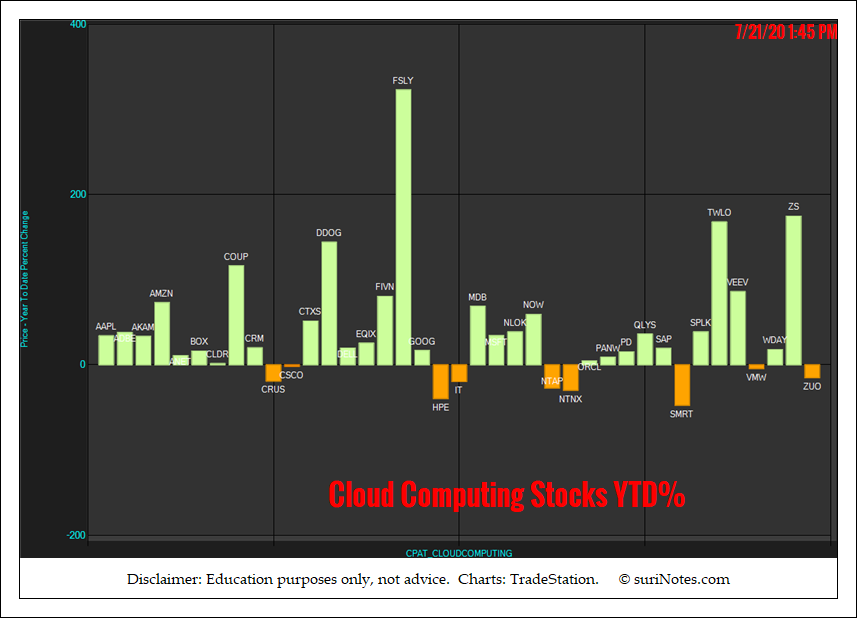
Here is a list of Cloud Computing stocks and their 2020 performance.
Cup & Handle Patterns
The Cup and Handle Chart pattern was developed and popularized by William J. O’Neil in the 1980s through his CANSLIM methodology, Investors Business Daily and his book "How to Make Money in Stocks."
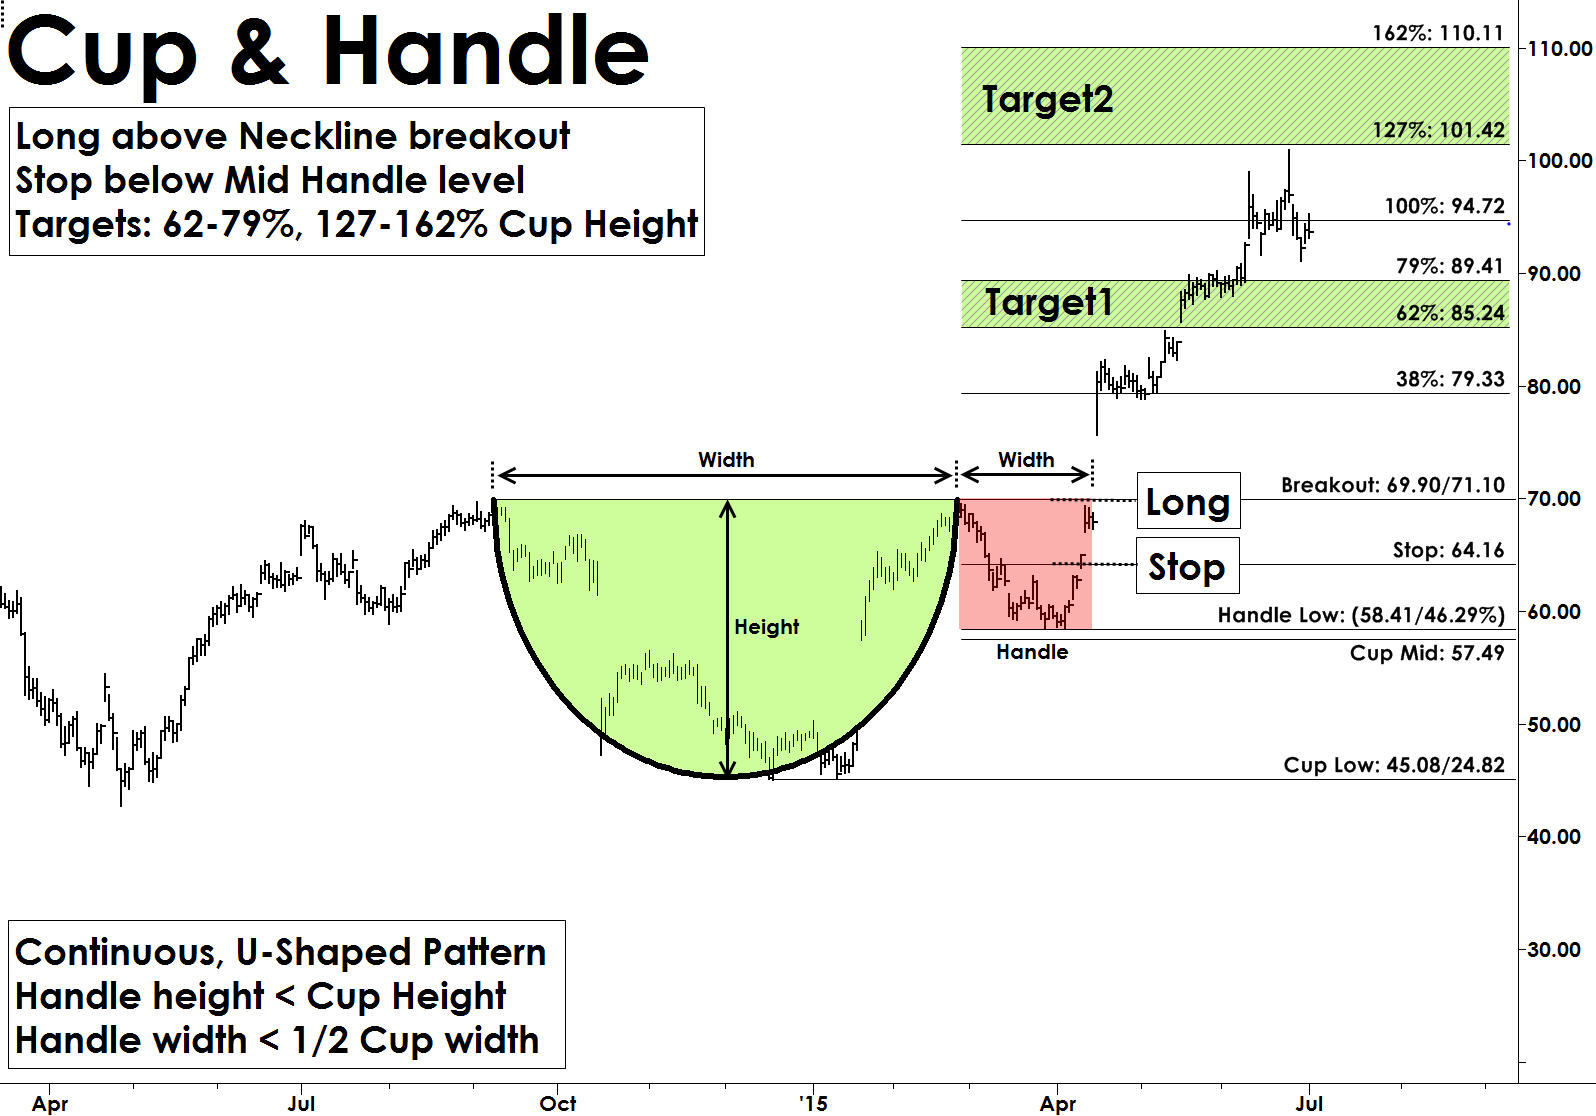
Cup and Handle pattern resembles a Cup with a Handle and are continuation patterns, which usually form in bullish trends. Most Cup and Handle patterns are very reliable and offer great trading opportunities. They also form in all markets and in all time-frames. The “Cup” formation is developed as consolidation phase during price rallies from the round bottom formation over multiple weeks to months. The “Handle” part forms due to a price correction after “Cup” formation and before a clear breakout to the upside.
Cup and Handle pattern structure show the momentum pause after reaching a new high in a U-Shape form, followed by another attempt to breakout. When this breakout from the rim of the cup fails it starts to fall back to build the "Handle" structure. Usually, the handle structures are small, and the handle depth should not exceed more than 50% of cup depth. This handle part of the pattern generates interest in buyers as they expect the pattern to breakout from these levels (see chart below). The pattern is valid only if price convincingly breaks out with increased volume above the rim of the cup levels.
Salesforce.com Pattern
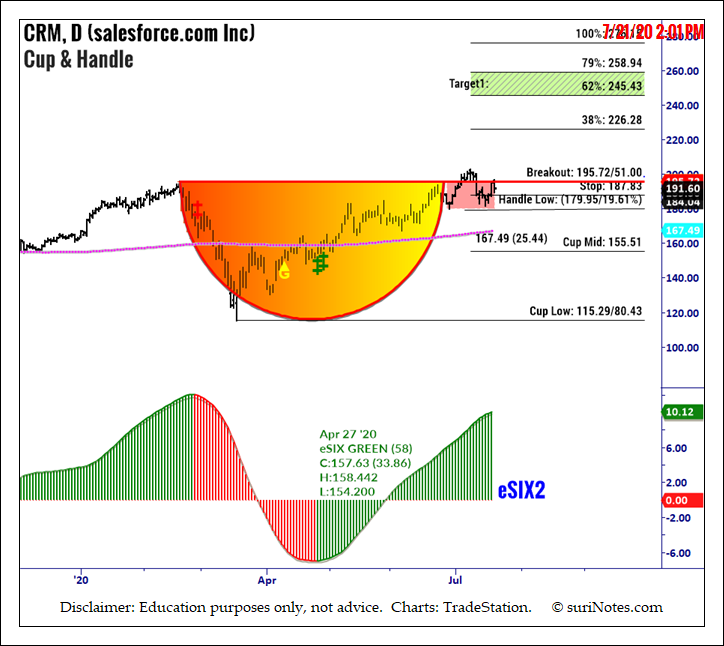
Salesforce.com Inc. (CRM) is forming a Cup and Handle pattern on its daily chart and trading near the breakout level of $195.82 (see chart below).
A breakout is signaled when price closes above the breakout level. The CRM pattern's mid cup Level is $155.51, and handle low is $179.95.
A stop is placed below the lowest low of the mid-cup or handle's low. Targets are placed at $226.28, $245.4 and $258.9.
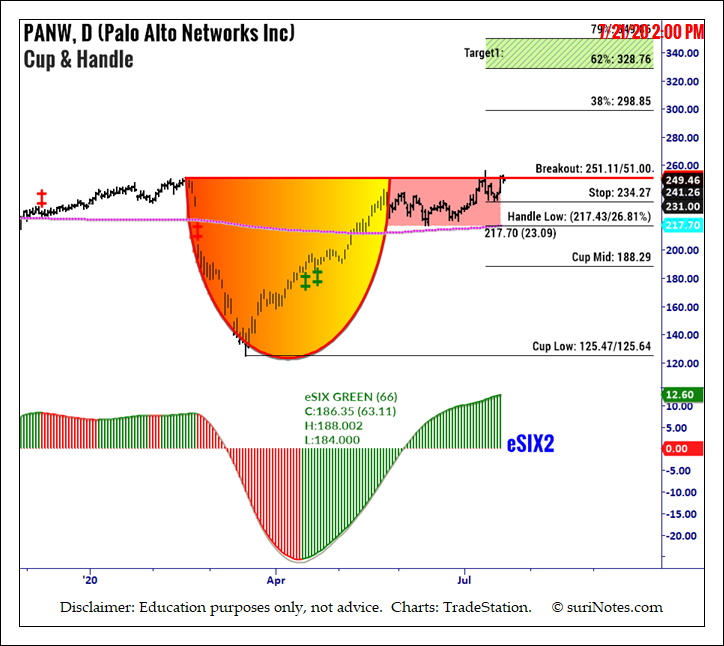
Palo Alto Networks Inc. Pattern
Palo Alto Networks Inc. (PANW) is forming a Cup and Handle pattern on its daily chart and trading near the breakout level of $251.21 (see chart below). A breakout is signaled when price closes above the breakout level. The PANW Pattern's mid-cup Level is $188.29, and handle low is $220.70. A stop is placed below the lowest low of the mid-cup or handle's low. Targets are placed at $298.85, $328.80 and $349.90.
Watch Suri’s archived presentation “How to Trade Chart Patterns With Market Context,” from Friday June 12 as part of the New MoneyShow Virtual Event. Find more of Suri’s work at surinotes.com.


