
A breakout signal in Conoco Phillips and long positions in the energy sector from Suri Duddella.
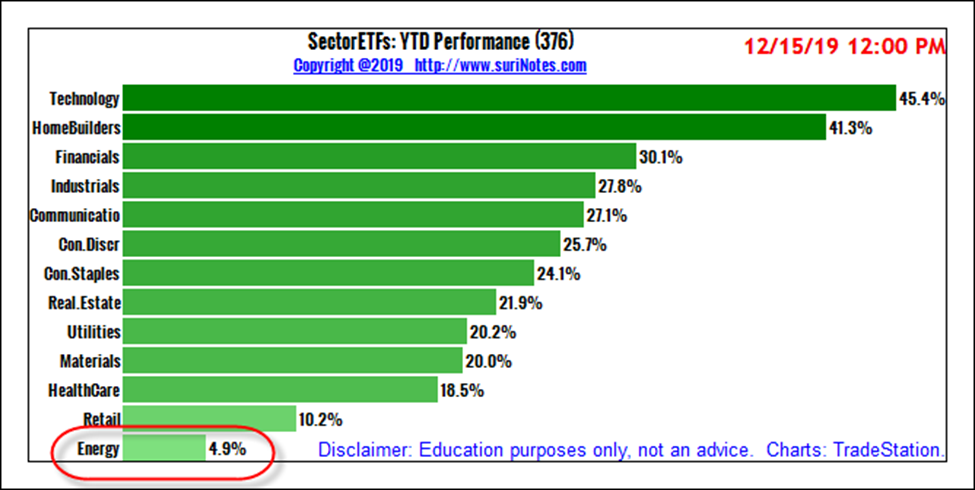
In 2019, the Energy Select Sector SPDR Fund (XLE) was the worst performing sector in S&P Sector ETFs, at 4.9%. The best performed exchange traded fund from the SPDR sectors was the Technology Select Sector SPDR Fund (XLK) at 45.4% year-to-date. Even in 2018, many energy stocks posted negative gains. In 2019, certain energy stocks were able to capitalize on rising crude oil prices and showed positive gains. Some analysts think 2020 may see the energy sector boost as crude oil supplies could be rich once again.
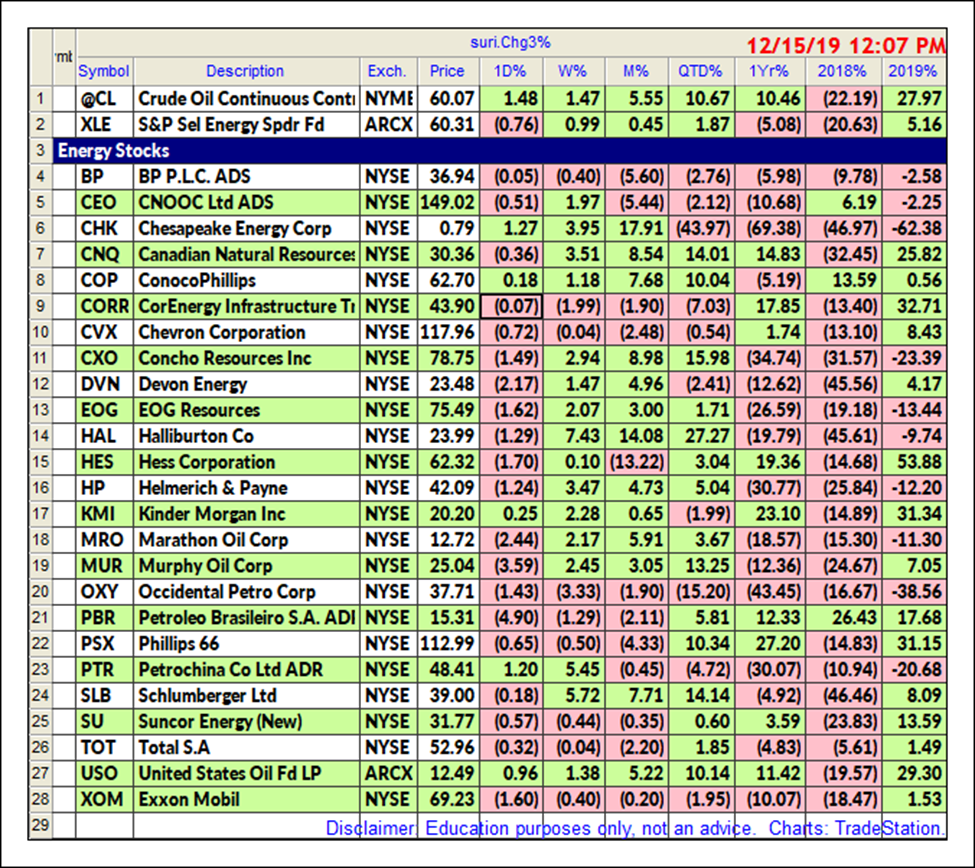
Energy Sector Stocks and their year to date performances in 2018 and 2019.
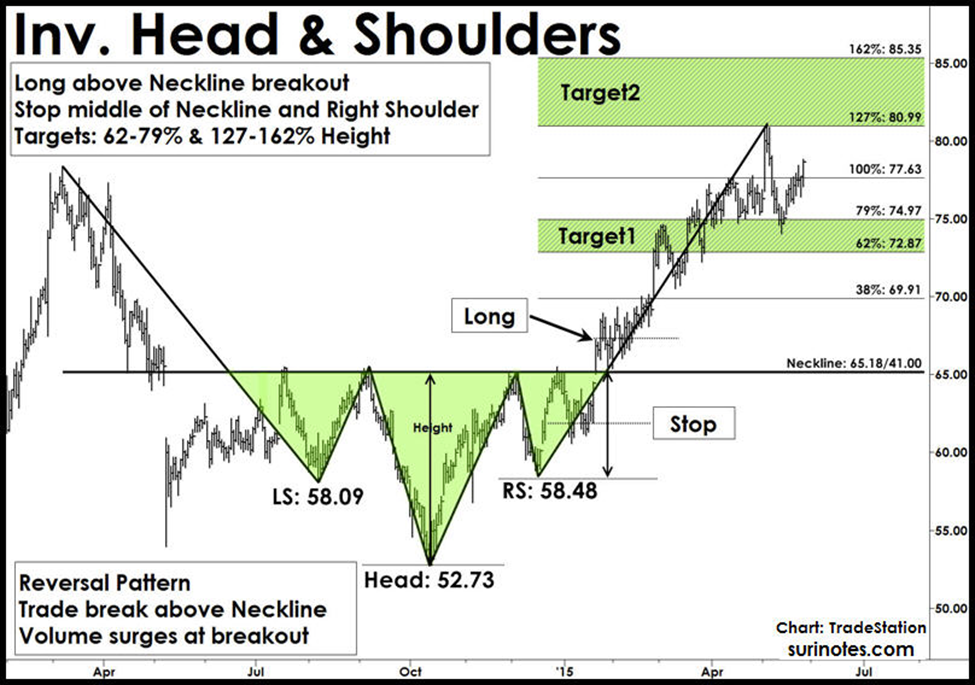
Inverse Head and Shoulders Pattern
One of the most popular chart patterns is the Head and Shoulders (H&S) pattern. The H&S patterns form near market tops in an established sideways to up-trending or bullish markets. The H&S patterns are reversal patterns as they reverse its prior uptrend and follow a bearish trend from its breakdown.
These patterns are signified by three successive peaks (tops) resembling two shoulders on both sides and a head in the middle. The head is the largest of the three peaks. An Inverse Head and Shoulders (Inv. H&S) pattern is the head and shoulders pattern upside down (mirror image) and follows a similar structure and trading rules in reverse. The Inv. H&S patterns are also reversal patterns and form in established downtrends.
Trading Inverse Head & Shoulders Pattern
Entry: After right-shoulder formation and pattern completion: If price closes above the neckline with increased volume, enter a long trade above the breakout bar's high.
Stops: 1. Place a stop below the middle of neckline and right shoulder
2. Place a final stop below the low of the right shoulder.
Targets: Targets are projected from the neckline level. Measure the height of the head and use Fibonacci ratios to compute targets. The first target range is 62% to 79% of the height of the head, and the second target range is 127% to 162% above neckline.
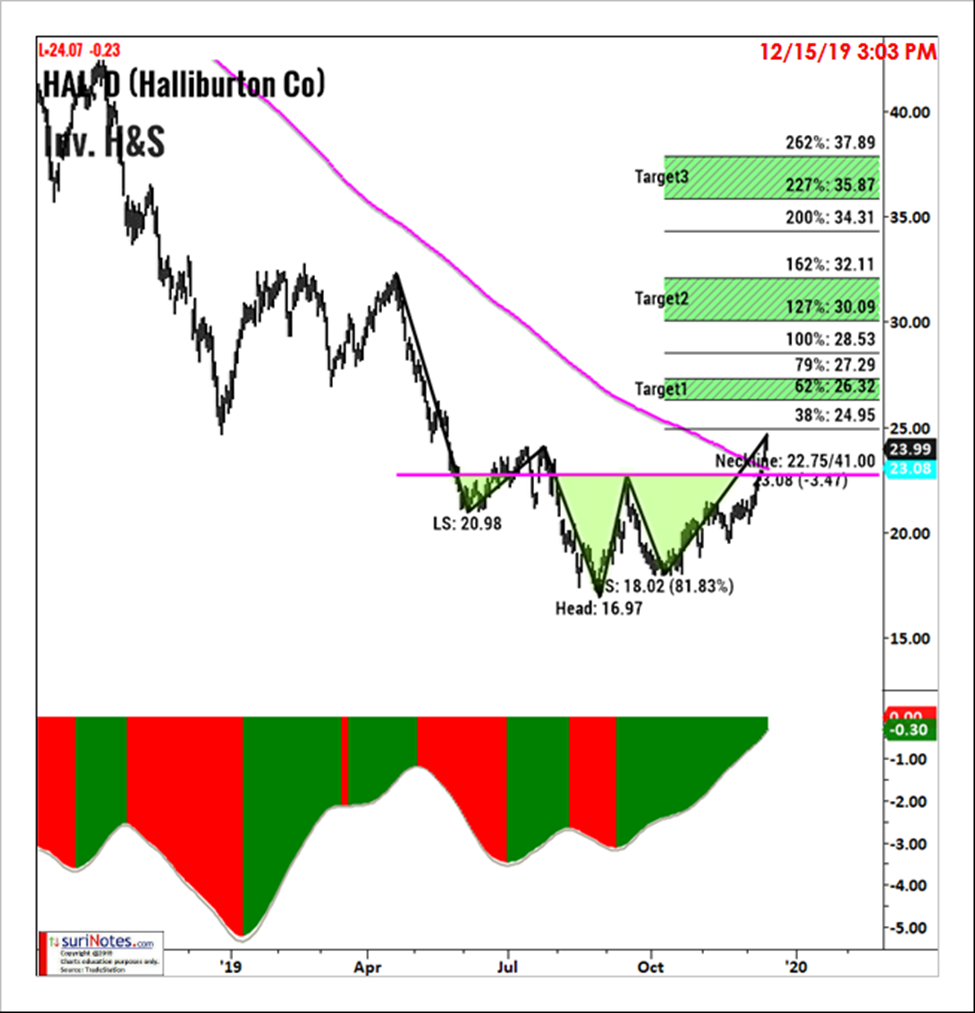
Halliburton Co. (HAL) and Conoco Phillips (COP) are energy sector stocks that are both exhibiting an Inverse Head & Shoulders Pattern.
The Haliburton daily chart (below) has an Inverse Head and Shoulders pattern formation from May 2019 until December 2019. In December 2019, the price closed above the neckline at $22.75 (also above 200-simple moving average) to signal a breakout trade. A long entry above $22.75 was signaled on Dec. 10 with a stop set below the midpoint of the right-shoulder to the neckline at $20.35. With a target range of $26.30 and above $30 there is still a lot of opportunity in this trade.
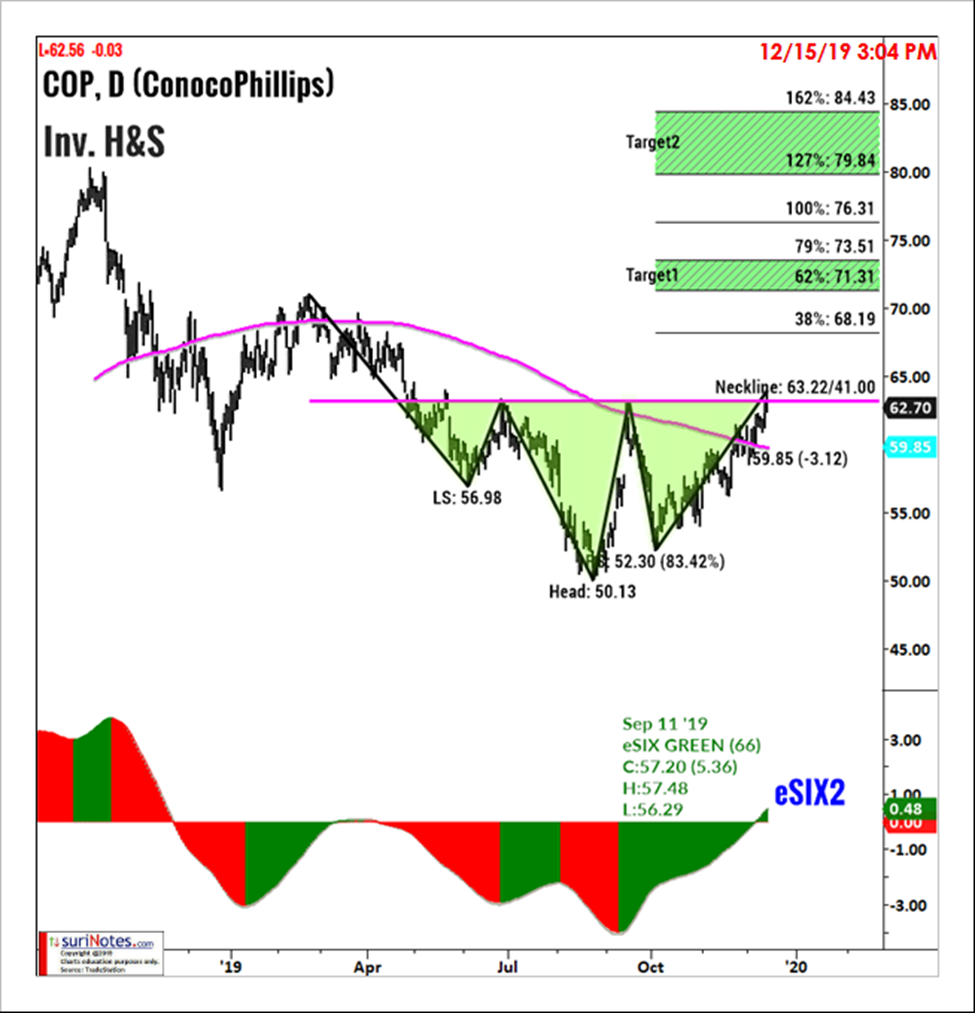
Conoco Phillips’ Inverse Head and Shoulders pattern formed from April 2019 until December 2019 between the prices of $50 to $63.22. COP's neckline is at $63.22. A long entry was signaled on Tuesday’s (Dec. 17) close when price settled above the $63.22 neckline. This is an opening signal with targets at $71 and a stop below $57.
Find more of Suri’s work at surinotes.com.


