An Economic slowdown is already priced into bond yields, writes Marvin Appel.
What a difference a year — 15 months to precise—makes. In September 2018 the bond market was priced for strong economic growth, with relatively high interest rates: more than a 3% yield in 10-year Treasuries, tight high yield bond spreads of 3.2% and 10-year inflation expectations of more than 2% (implied in the Treasury markets). Then the markets abruptly switched during the fourth quarter of 2018, acting as if a recession was at hand.
Looking at the S&P 500 Index or the Nasdaq Composite you would think that all is well as these indexes made a string of new record highs in 2019. However, the bond market has not confirmed this optimism. Rather, a certain foreboding remains priced into bonds. That spells modest opportunity in junk bonds and limited upside from investment grade bonds in 2020. Let’s review some different areas of the bond market that are all painting a consistent picture of slow economic growth in 2020.
Treasury market
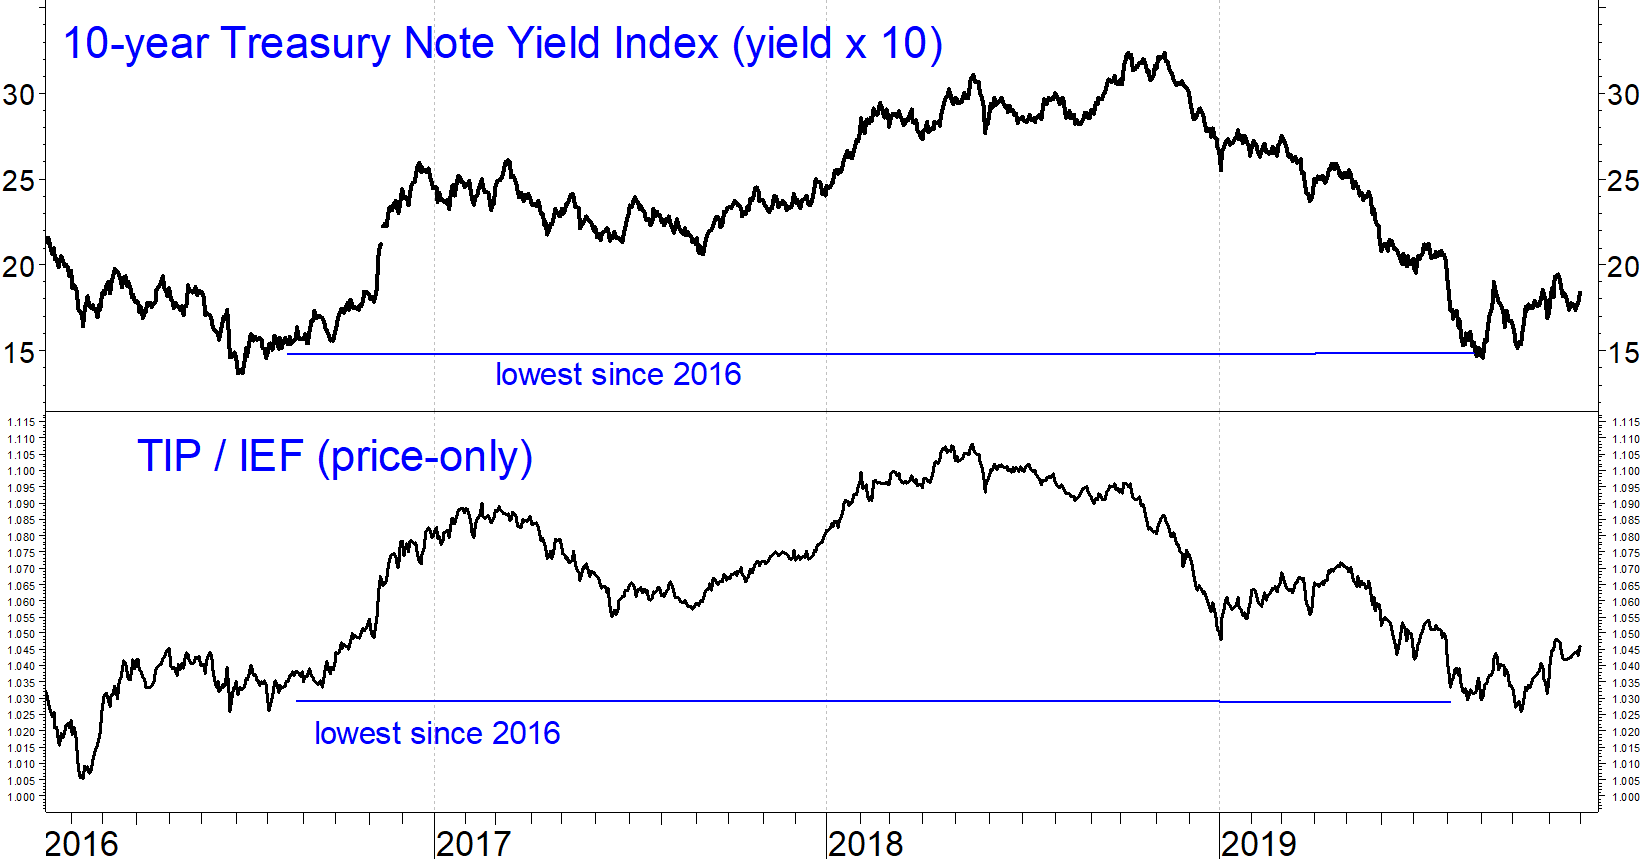
The Treasury market gives two indications of economic prospects. First is the level of long-term interest rates; 10-year yield, for example. When this falls it means that the economy is expected to slow. Ten-year yields remain near record lows, near their lowest levels since the last recession scare in 2016 (see chart below). This means that there is little room for Treasury notes or investment-grade bonds generally to appreciate in price or to generate attractive levels of interest income.

The only bullish case for investment-grade bonds going forward is a significant recession, which some say could bring negative U.S. interest rates. Fortunately, as we will see below, the high yield bond market is not signaling the risk of a recession.
The second Treasury-based indicator is the relationship between nominal Treasury notes (conventional notes with fixed coupon payments) and Treasury Inflation-Protected Securities (TIPS) where the total return depends on how much inflation occurs over the life of the bond. The stronger the economy is expected to be, the better TIPS will perform relative to nominal Treasuries. The chart above shows the TIP/IEF ratio, which compares price movements in exchange traded funds (ETFs) that track TIPS and seven- to 10-year nominal Treasury notes (IEF). The TIP/IEF ratio has been falling since mid-2018 before seeming to hit bottom in October, again showing that the risk of an economic slowdown has already been priced into the Treasury market.
It is interesting to note that the total return on 10-year TIPS will match those of 10-year Treasury notes if inflation over the next decade averages 1.6% per year. A decade of such low inflation has occurred just once since 1964, from 2007 through 2016, a period which included the Great Recession of 2008-2009.
Corporate high yield bond funds
The chart below shows the spread in yield between corporate high yield bonds and Treasuries. From mid-2017 until mid-2018 corporate high yield bond spreads were very tight, meaning that the bond market was pricing in very little credit risk for high yield borrowers. However, during the fourth quarter of 2018 spreads widened from 3.2% to 5.4%. Note that in 2015-2016, junk bond spreads almost touched 9%. This means that as far as the junk bond market was concerned, recession risks even at the worst part of 2018 were not as serious as in early 2016. Now, junk bond spreads have settled into the 4% area. Compared to the period of tight spreads in the chart, current spreads are distinctly more pessimistic. But current spreads are nowhere near high enough to signal a serious recession threat.
As is often the case, corporate high yield bonds represent the best bond opportunity in 2020. I particularly favor short-term corporate high yield bonds, as represented by the SPDR Short-Term High Yield Bond ETF (SJNK), which yields 5.1%; very close to the 5.2% yield on the SPDR High Yield Bond ETF (JNK). In the current flat yield curve environment, you are getting paid very little for the added duration risk of intermediate-term junk bonds compared to short-term.
Floating rate bonds
Floating rate bonds are loans to below investment-grade borrowers, as are high yield bonds. The difference is that floating rate bonds adjust their yields every three months in parallel with changes in the Fed Funds rate. Because the Federal Reserve raised rates in 2018, floating rate bond funds were the best area of the bond market in 2018. However, with the Fed cutting interest rates three times in 2019, floating rate bond funds have lagged corporate high yield bond funds.
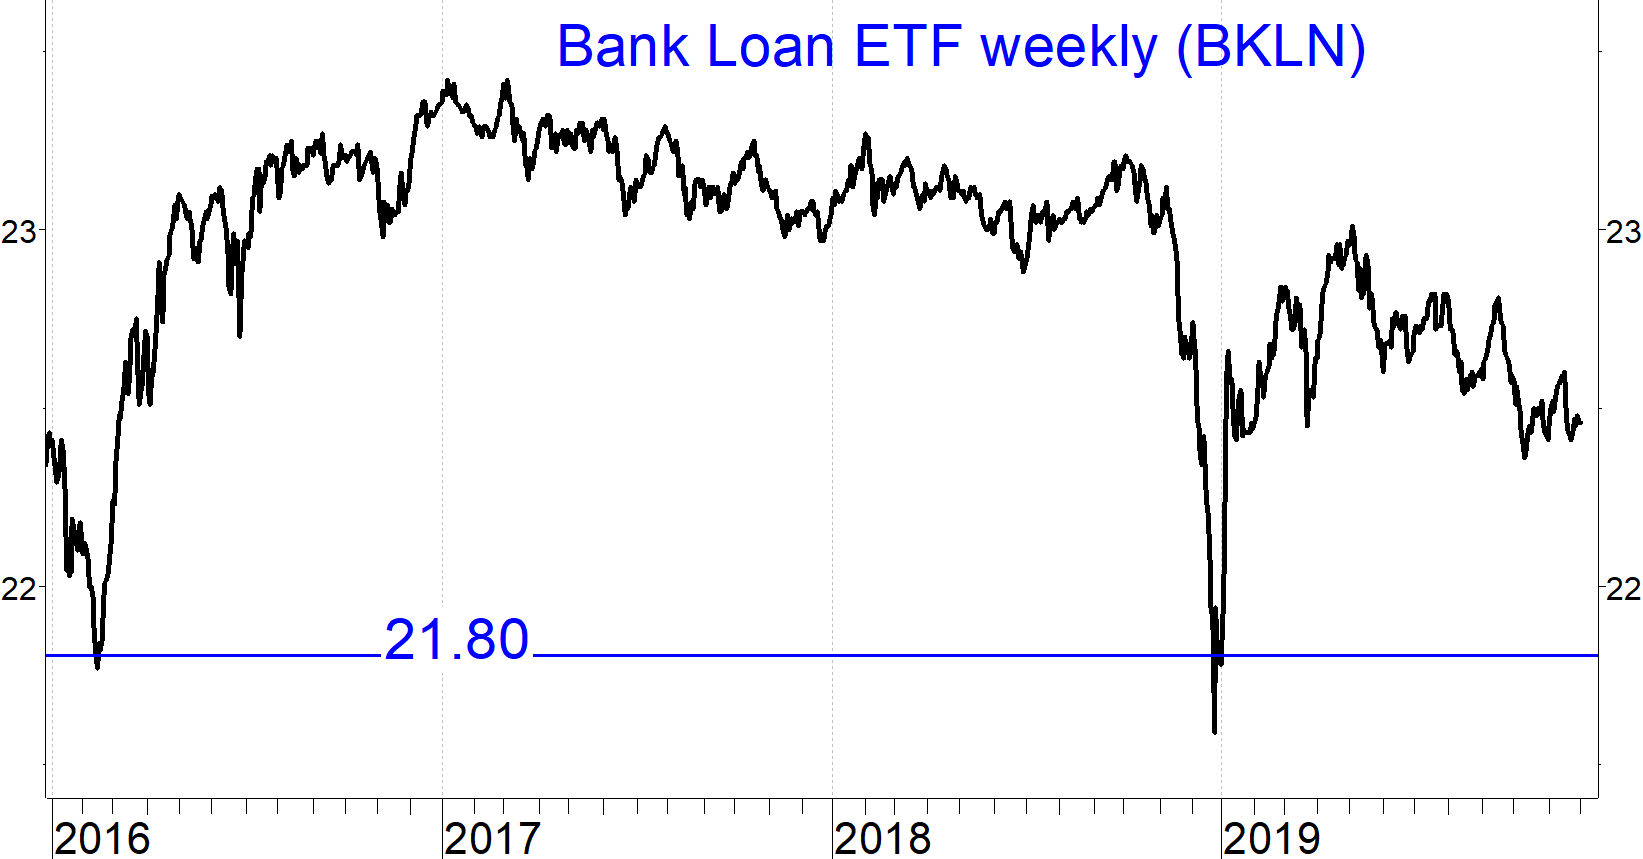
As with high yield bonds, the prices of floating rate bonds can be viewed as a measure of economic optimism. The chart below of the Invesco Senior Loan ETF (BKLN), price-only, shows that the prices of these bonds has been trending down since the start of 2017. The sell-off intensified in May 2019.

Although high yield bonds face similar credit risks as floating rate bonds, they have held up better in the last six months. In part this is likely due to the drop in interest rates in 2019 which is a favorable development for fixed-coupon high yield bonds but not for adjustable rate loans. Given the evidence from the bond market that the economy is likely to become more sluggish, there is little prospect that the Fed will raise rates in 2020. Until the start of the next cycle of Fed rate hikes, I recommend de-emphasizing floating rate bond funds. This year, we have reduced our allocation to these funds and shifted capital into short-term corporate high yield funds.
Municipal bonds
Investment-grade municipal bonds are relatively overvalued compared to investment-grade taxable bonds. Investors in high tax brackets in high-tax states might still achieve better after-tax returns from municipal bonds than from taxable bonds, but the amount of that advantage is low by historical standards. The chart below compares the yields of investment-grade municipal and corporate bonds.
In contrast, high yield municipal bond funds are attractive in the sense of being the best house in a bad low-yield neighborhood. Despite the potentially higher credit risk, high yield municipal bond funds have been tracking the performance of investment-grade municipal bond funds for the past decade, but with higher yields and higher total returns. Even during recession scares such as 2011 or 2016, these funds held up. On the other hand, when interest rates jumped in 2013 and 2016, these funds fell alongside their more creditworthy investment-grade peers.
Note that in 2008, the perfect storm of liquidity problems and recession caused major losses in high yield muni bond funds. But with the bond markets indicating a sluggish but stable economy in 2020, high yield muni funds should perform relatively well compared to other types of municipal bonds. One fund to watch is the Nuveen Short-Duration High Yield Municipal Bond Fund (NVHIX). Because of its duration of 3.8 years, NVHIX affords you some protection in the unexpected event of a jump in interest rates. The SEC yield (the yield bond mutual funds must disclose according to Securities and Exchange Commission rules) of NVHIX is 2.8% which is free from federal but not most state income taxes.
Bottom line
Because we are starting the year with low interest rates, bond investors will have to settle for modest returns in 2020. The economy looks to muddle along, but the good news is that there is low recession risk. It appears that the Fed will leave short-term rates where they are. If there are any changes, the Fed is more likely to cut rates than to raise them. I expect long-term interest rates to remain roughly where they are now.
In this market climate, short-term corporate high yield bond funds appear to offer the best balance between risk and return. High yield municipal bond funds, particularly the Nuveen Short-Duration Muni High Yield Fund, are also attractive. Total returns from short-term corporate high yield funds should be about the same as their SEC yields, approximately 4%. Similarly, total returns from high yield municipal bond funds should be in the 3% range, free of federal income tax.
Sign up here for a free three-month subscription to Dr. Marvin Appel’s Systems and Forecasts newsletter, published every other week with hotline access to the most current commentary. No further obligation.


