Yesterday’s market carnage lines up with some of our major time windows and could indicate a major turning point, reports Jeff Greenblatt.
On Wednesday financial markets got torched again. This time on worries of an inverted yield curve and the ongoing crisis in Hong Kong. In the very least, this is going to cost the good people of Hong Kong because they are going to lose a lot of convention business the next few years. The fear is its going to be a lot worse if the Chinese decide to step in to restore order.
They have the same problem as Trump. If the Chinese step in to create some type of historic event like they did 30 years ago in Tiananmen Square, financial markets are going to tank. They are already tanking. Chinese intervention into Hong Kong would be much more significant than Tiananmen Square. While a tragedy, there was no real anticipation that the United States would intervene into an internal Chinese conflict as was the case 30 years ago, but Hong Kong became the Hong Kong Special Administrative Region (SAR) in 1997 when it left British influence. It became part of China but with its own system with anticipation that its independence would be protected by the West.
Like Trump, the Chinese need the stock market to stay up. At what point do they throw caution to the wind, as far as the economy is concerned?
What we are living through is what some call the Fourth Turning, it’s an 80-year generational cycle and a best-selling book that came out in 1996 by Neil Howe and William Strauss. They looked back five hundred years and revealed certain traits and patterns among the generations. As far as we are concerned, each 4th generation going back has been significant since the birth of the Republic. These cycles have outlined the Great Depression/WWII, Civil War and the original Revolutionary War.
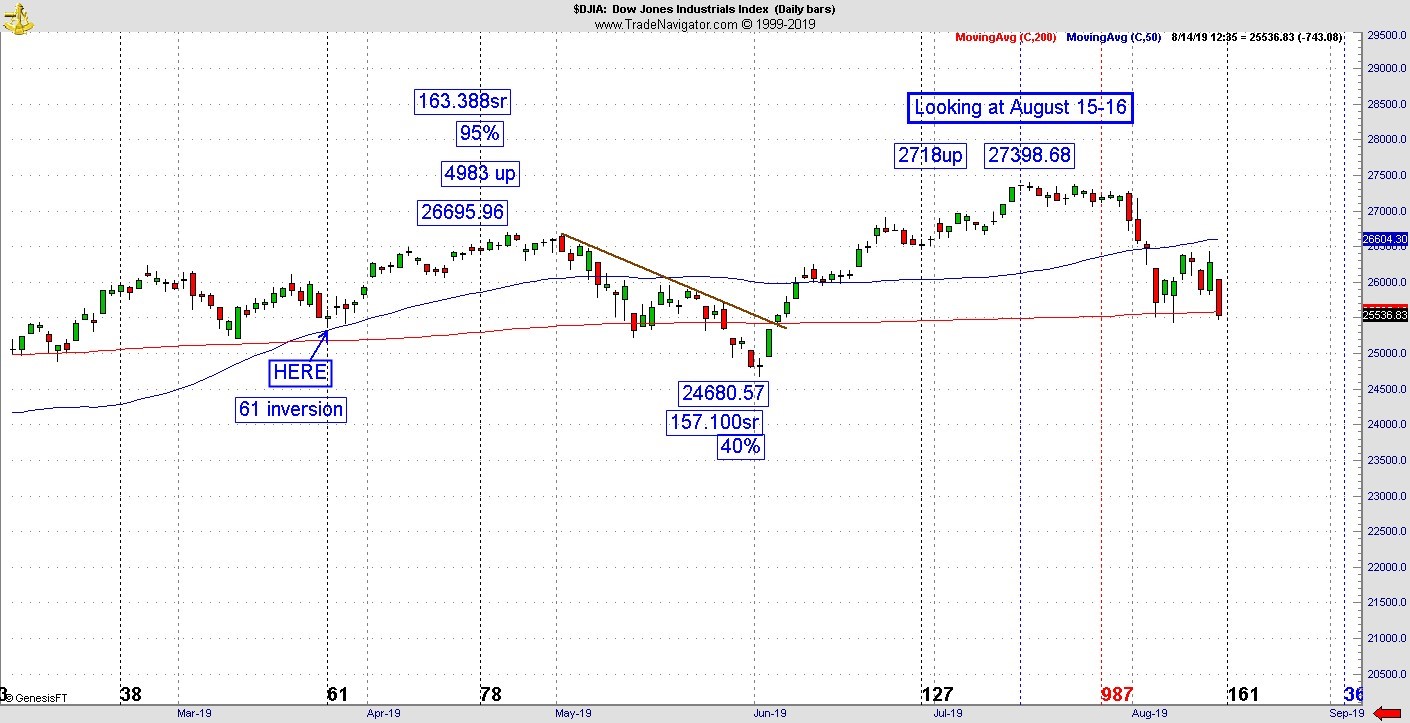
Since I started talking about this book about a year ago, I’ve been asked if there is a time window for it. The short answer is no, but given the size of this time window, what we are going through right now, it could be the zero hour for this cycle. On Thursday, the stock market is 161 days from the December low. That is the same day it hits 618 weeks off the October 2007 peak in the Dow and SPX. On Wednesday, the day the market got clobbered, it was still 617.90 weeks (see chart below). There are other, even bigger cycle points maturing this month. Enough points to consider the stock market could finally be colliding with history.

It seems the ship hit the iceberg a day early. Given some fear came into the market, is it possible we could still end up with a low as opposed to a high by the end of the week? Sure, it is but I don’t think it matters anymore. Any low achieved here might only get a bounce for a couple of weeks leading into the last phase of the time window. Recall the tech indices topped three weeks later in 2007. We could get a relief bounce from all this but let’s also not forget the last two weeks of August are the equivalent of holiday trade at the end of the year because people traditionally go on vacation before school starts up in September. We are now on the back end of the four-year presidential cycle and markets no longer have the wind at their back. I’m sure you’ve noticed the stock market now absorbs every gust of wind, that we are on the other side of the cycle as opposed to being impervious earlier while the favorable side was still building.
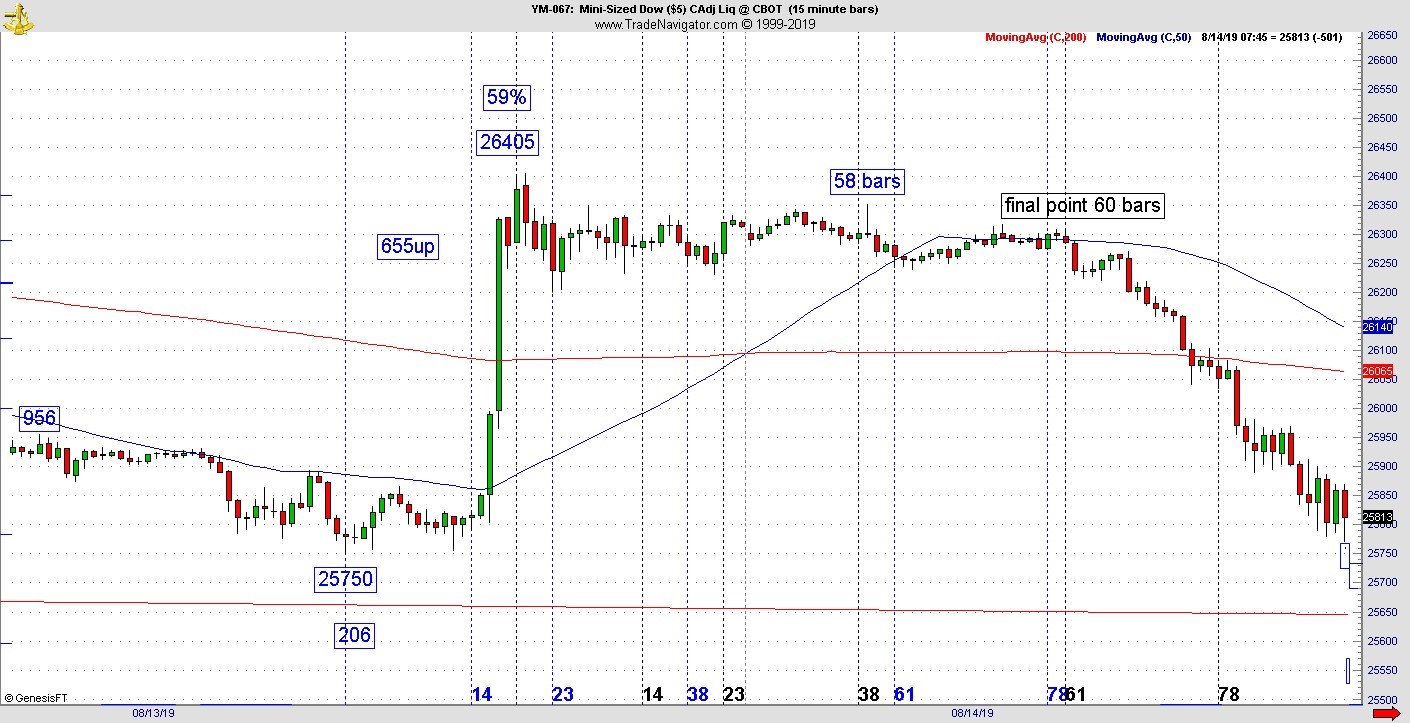
Tne major takeaway from today’s drop is the fact President Trump might not be able to bang the table to keep his rally going anymore. As we all know, on Tuesday he declared relief on certain tariffs which would be delayed. The Dow was instantly up more than 400 points. But this high was never taken out. It didn’t even take 24 hours for history to negate his words and trap whoever bought that news. But here’s our Kairos trading lesson, which identified how the market went over the cliff. Unfortunately, not many people were watching because it only setup in the overnight action. At yesterday’s high, the YM had retraced back up 59% of the move down from the end of July (see chart).

That’s became important when it started declining at 58 bars off the beginning of Tuesday’s rally point. The tail you see on the chart was never higher again. Adding insult to injury the exact point it went over the cliff and started falling was 60 bars off the high. The inflection vibration is the 59% retracement at the high which triggered at these two points to create the waterfall. Also, important to note the high in the YM on July 23 was 27358. So, you can readily see how this 58-59 vibration keeps replicating.
Even if we do get a ‘fear’ low by the end of the week, odds have now greatly increased for the confirmation of the top for 2019 to come no later than the final major time window around the Labor Day time frame.
If you want more information, go to: ucaswaveinternational.com and sign up for the free newsletter.


