The QuantCylce Indicator is showing an interesting set-up in the Philadelphia Gold and Silver Index (XAU), which is being confirmed by the actual commodities, notes John Rawlins.
The Philadelphia Gold and Silver Index (XAU) includes 30 precious metal mining companies.
The XAU is approaching overbought territory on its long-term weekly chart, which is being confirmed on both its daily and 240-minutes QuantCycle charts.
All three QuantCycle charts shows XAU in the midst of a downturn as it was touched overbought territory.
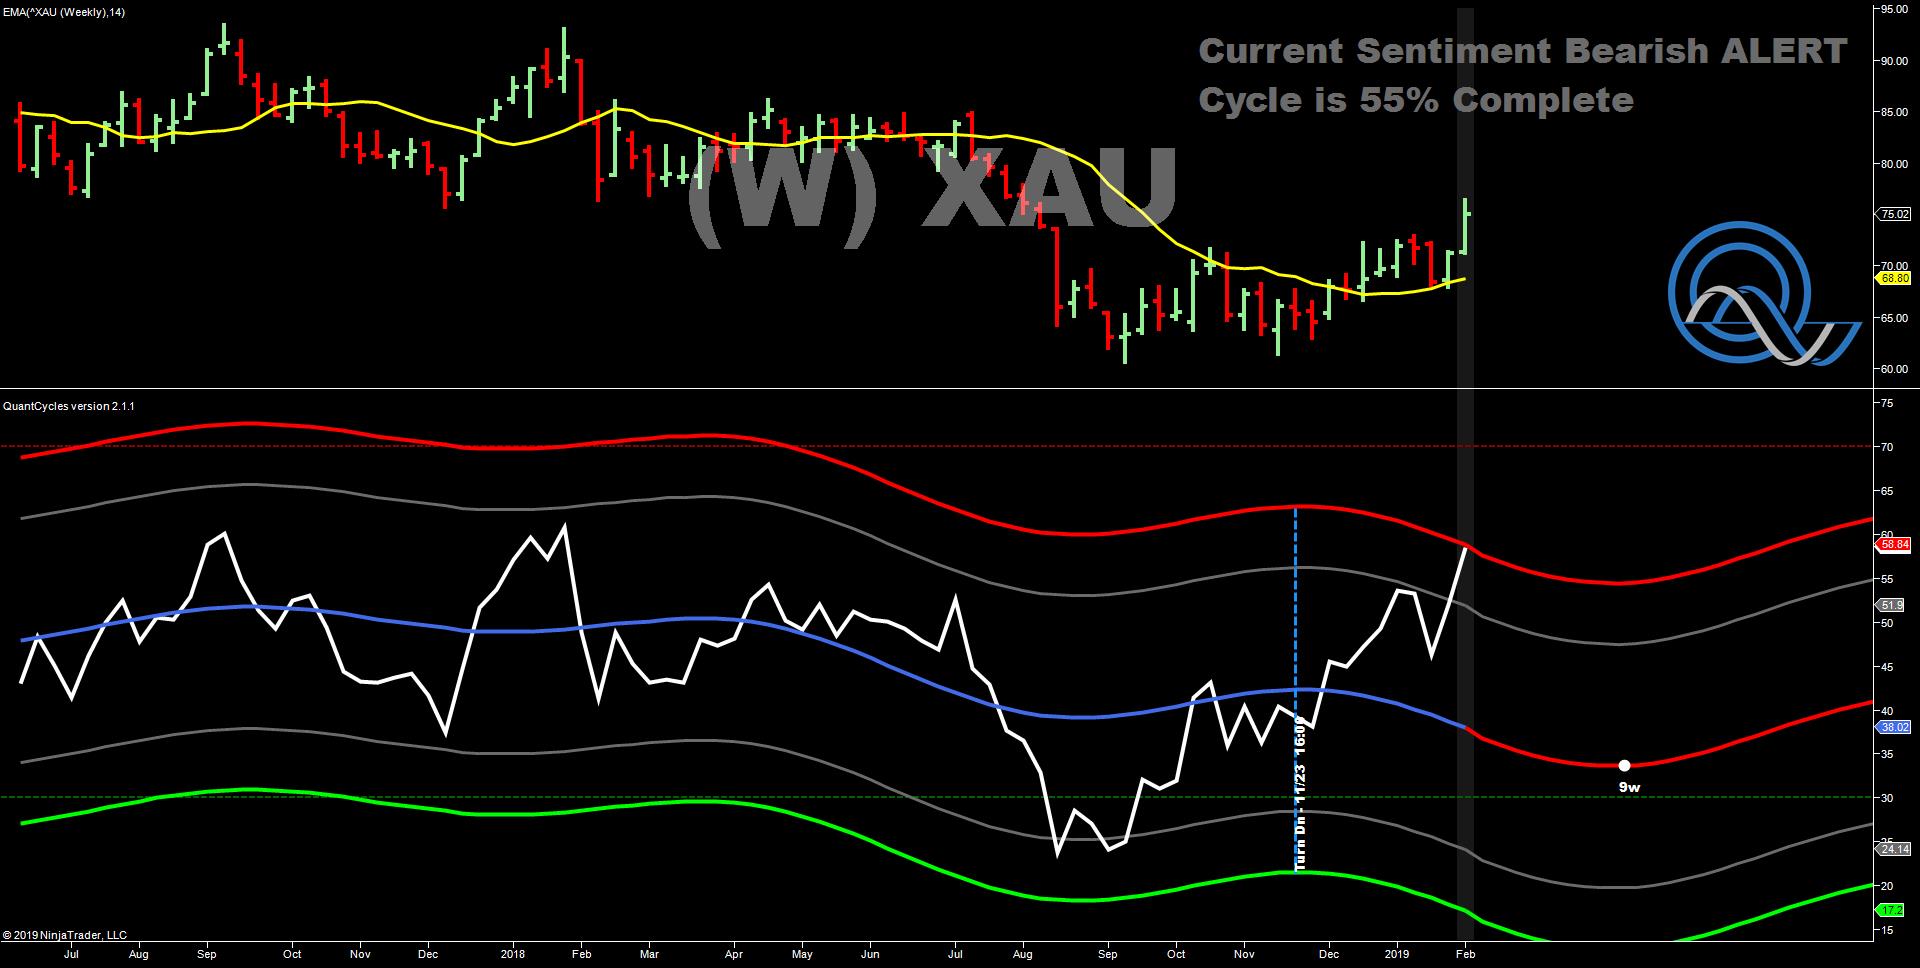
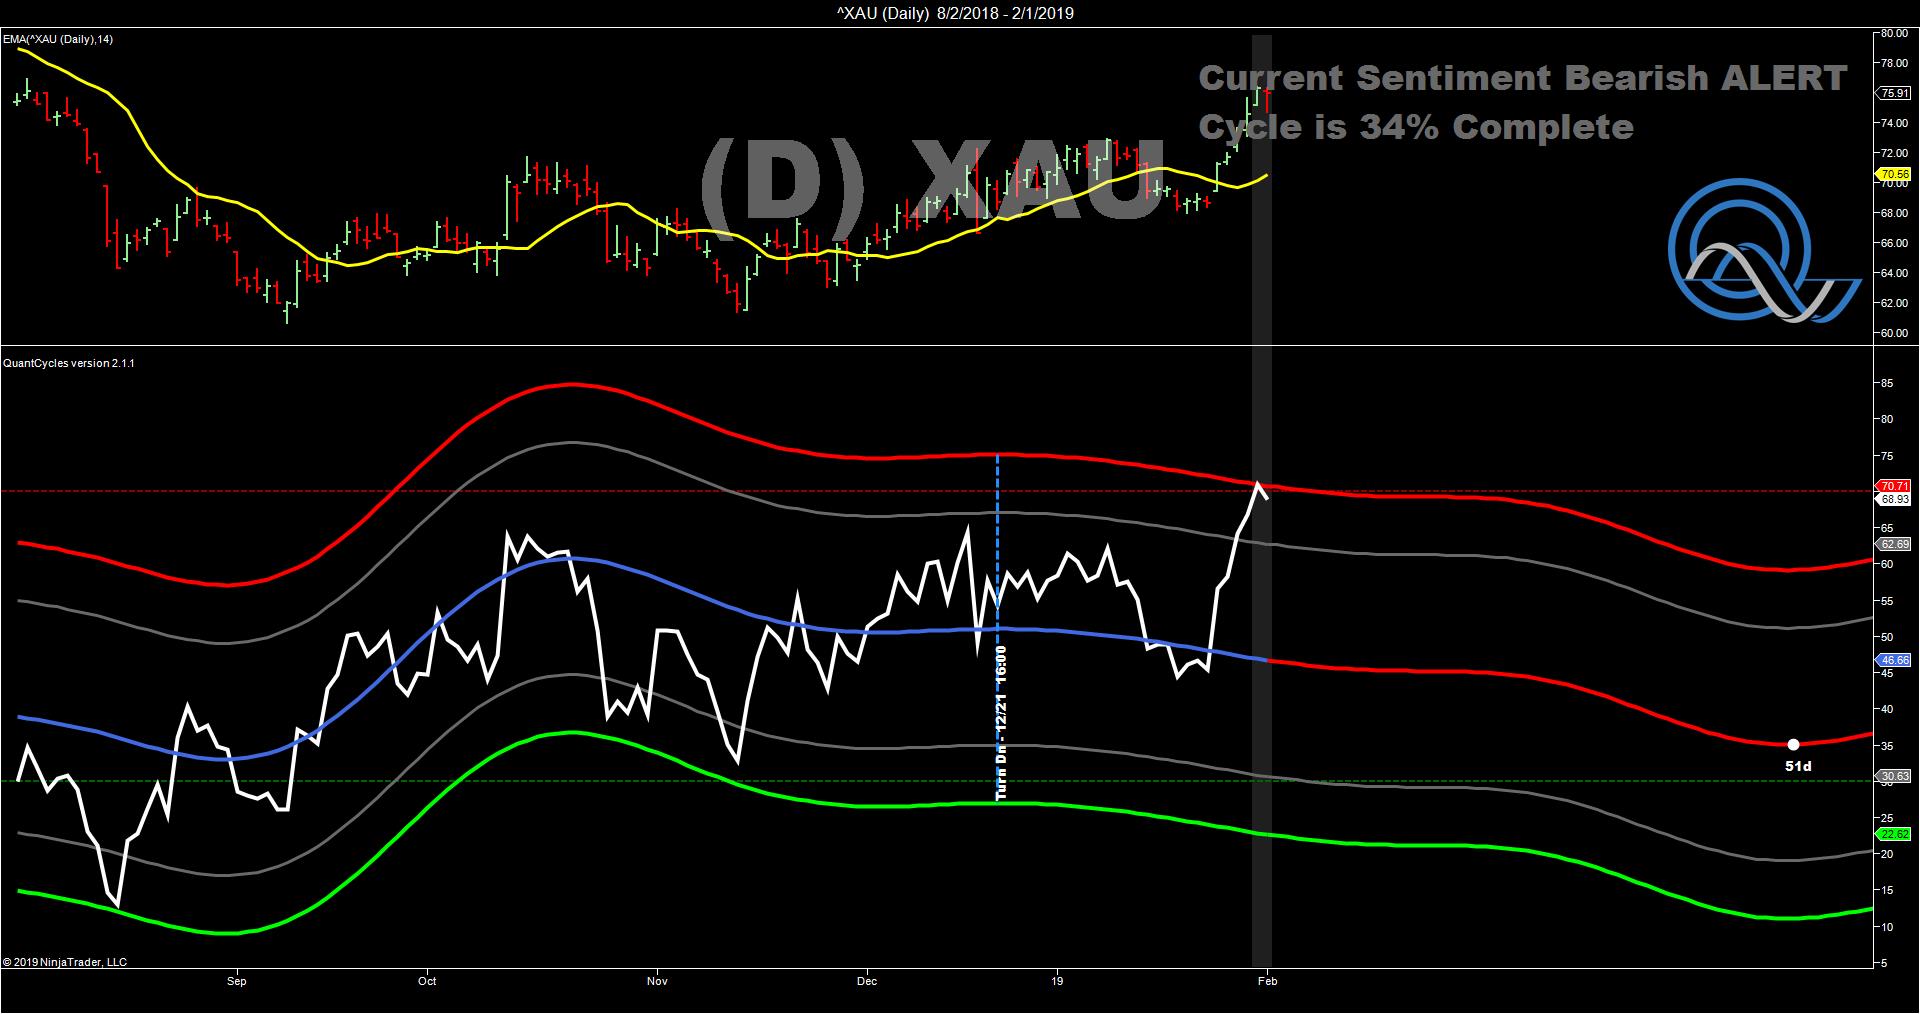
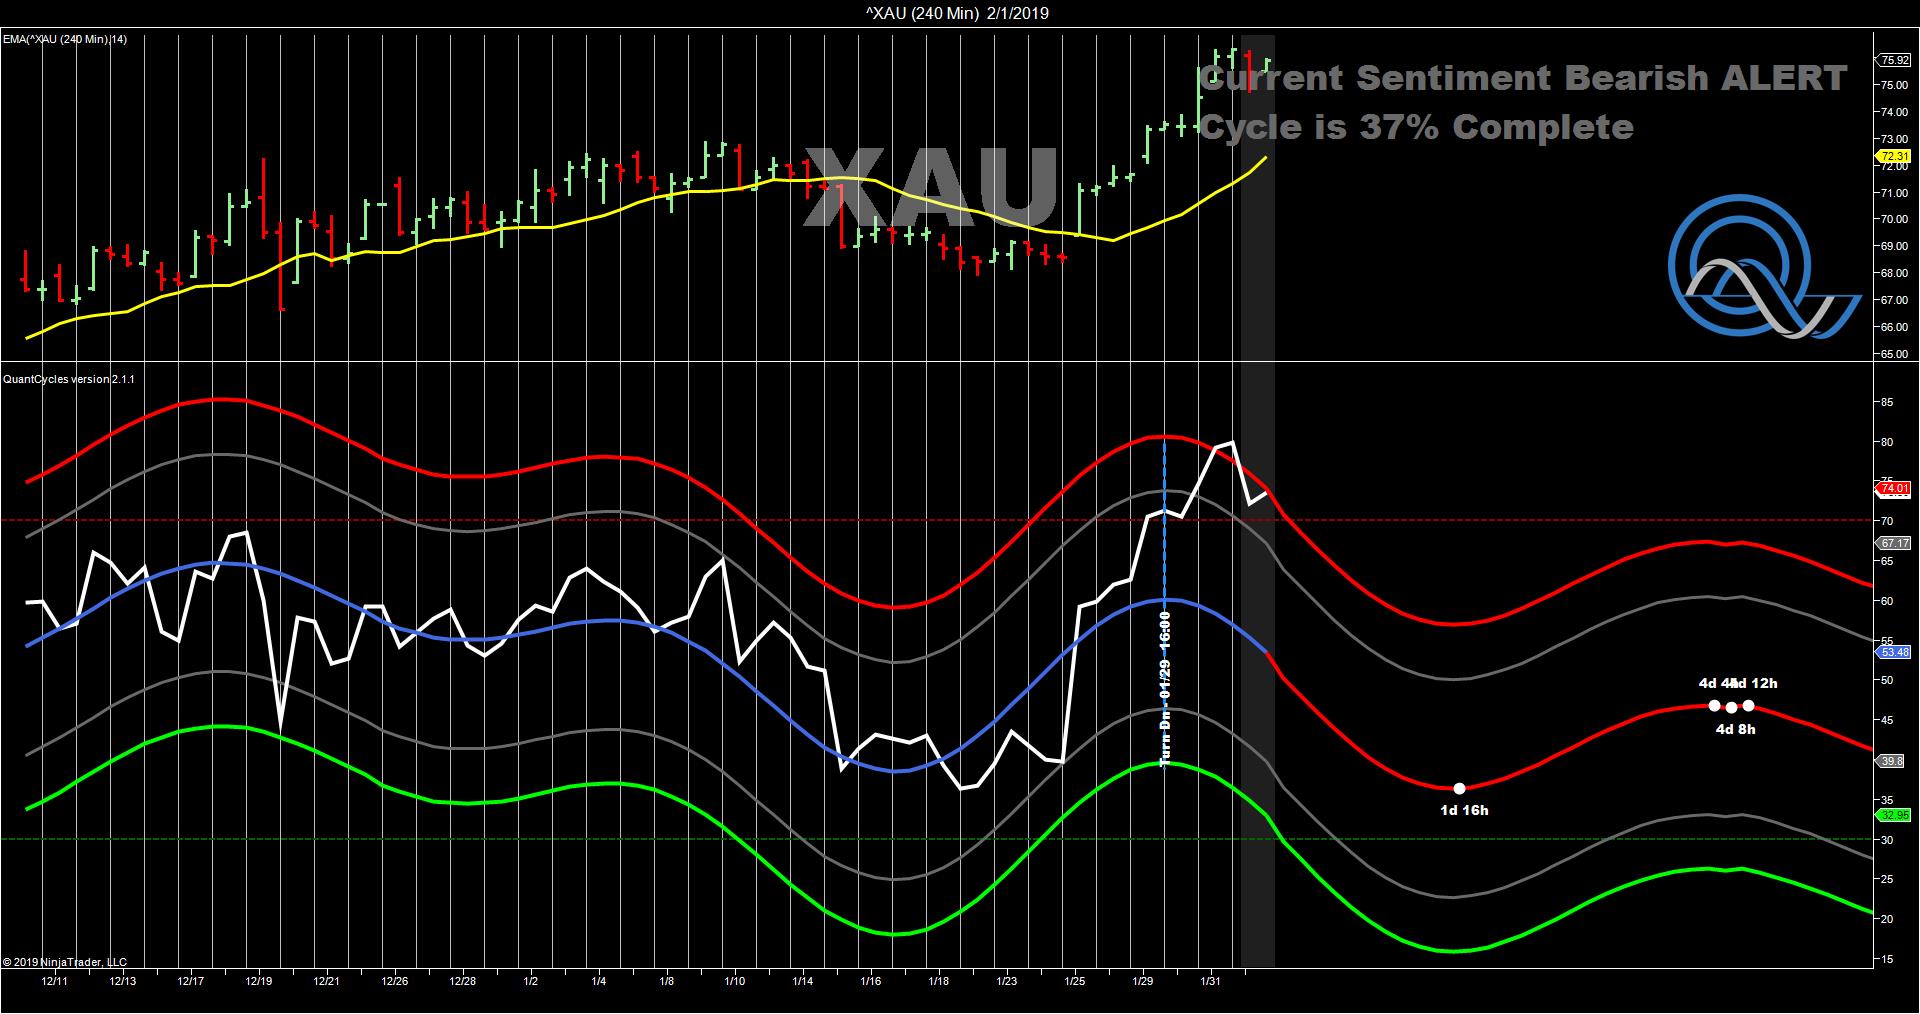
Friday’s weakness (see last bar of daily chart) may be the beginning of a larger move. However, although the daily QuantCycle suggests a slow steady move downward, the 240-minute QuantCycle indicates that XAU could rebound a little later in the week. It suggests you should get short on Monday, and, depending on your time frame, take partial profits later in the week.
Weakness is this sector is also being confirmed by the QuantCycle daily charts for gold and silver.
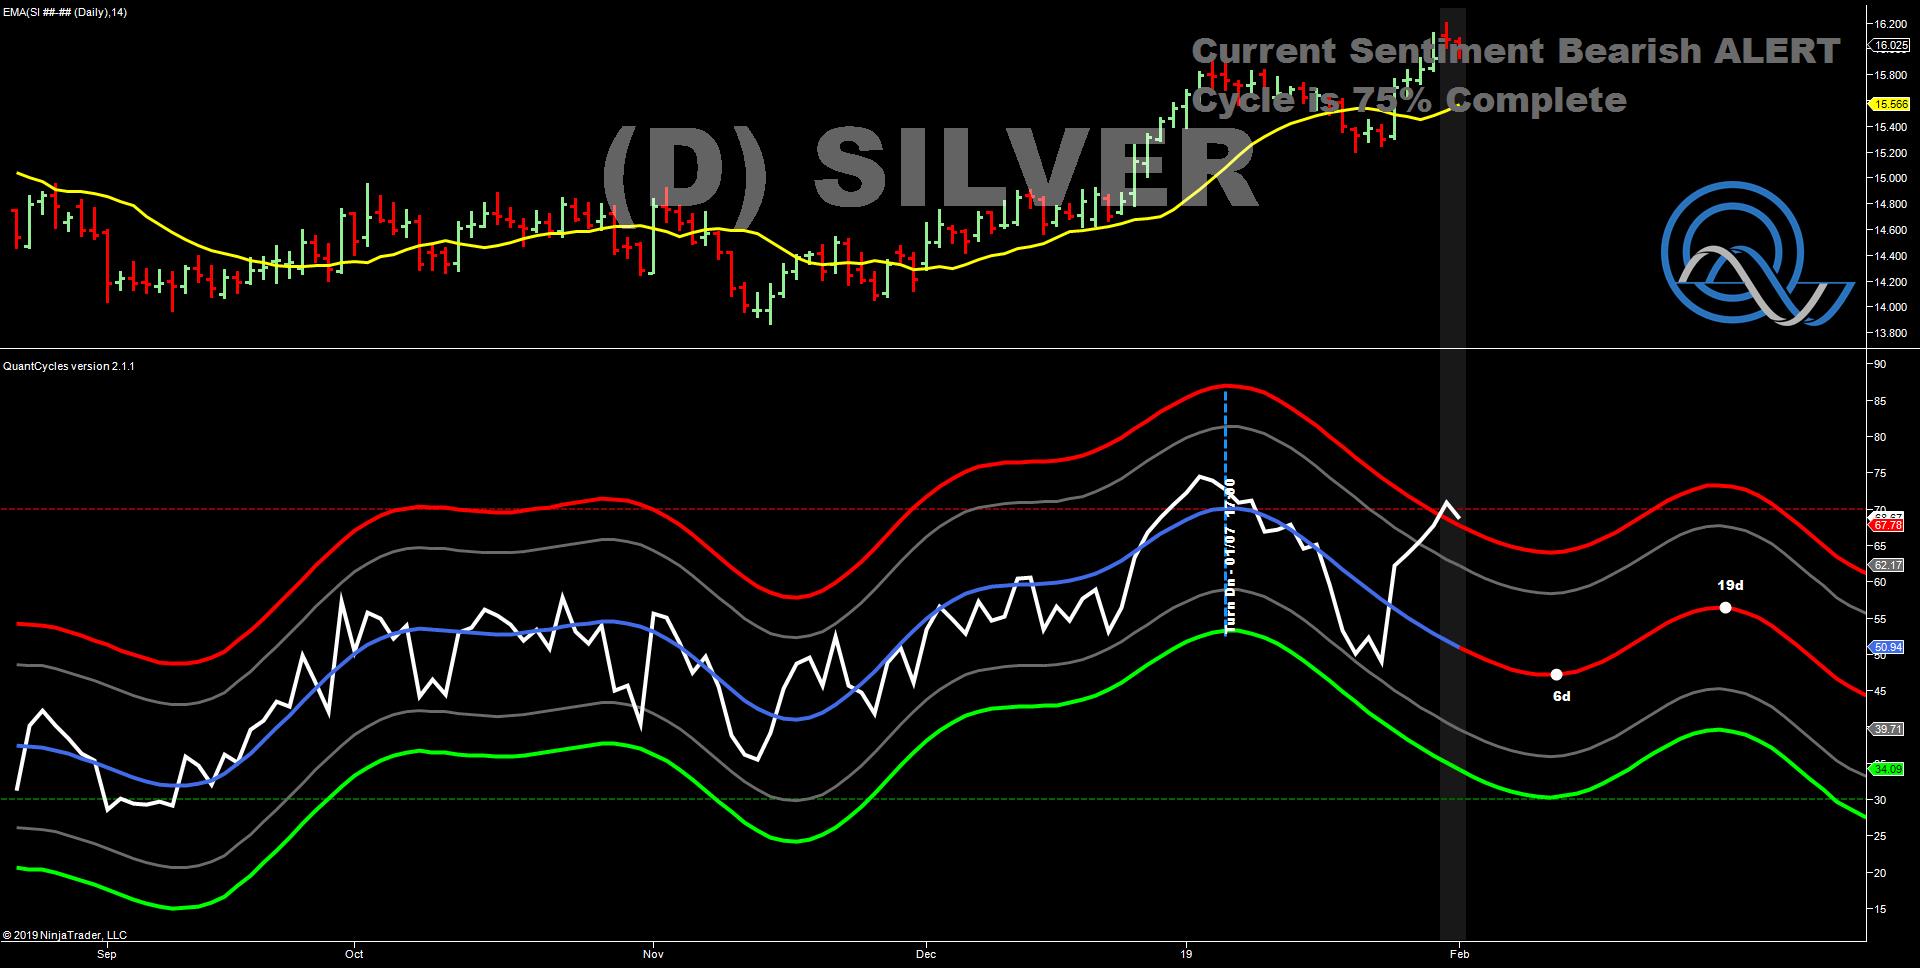
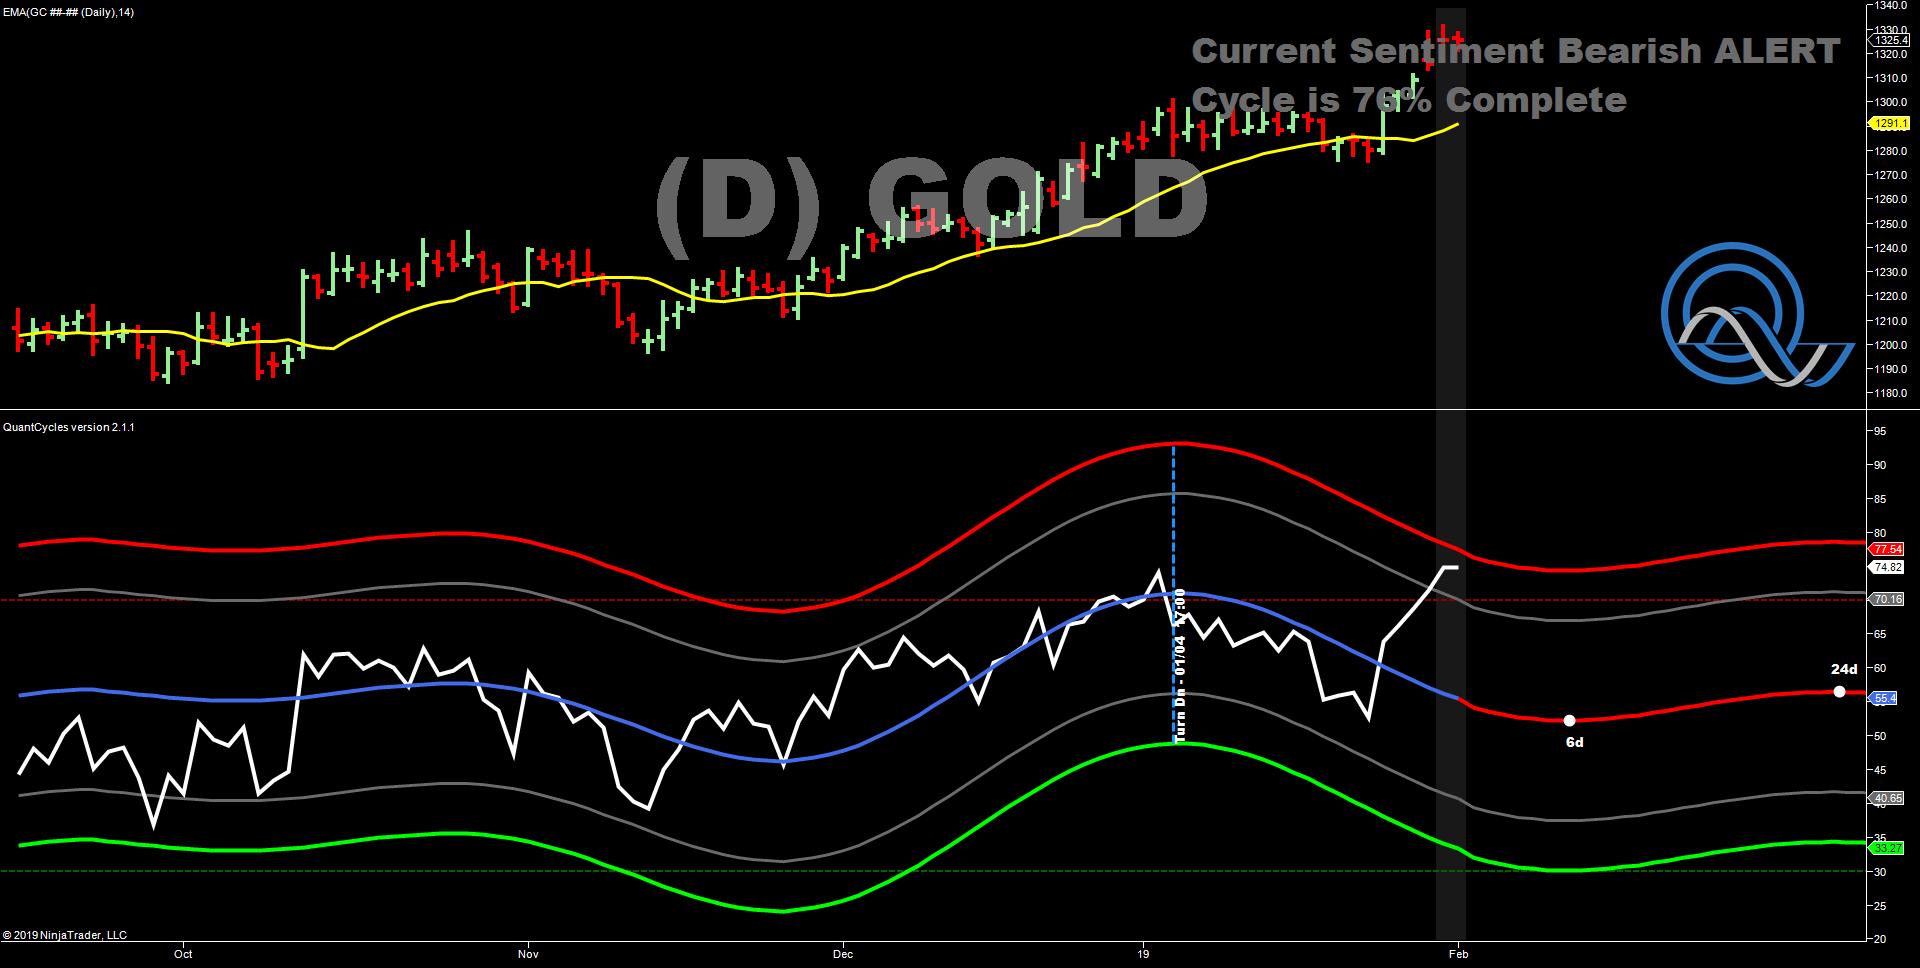
However, the longer-term QuantCycles in the actual commodity futures has an upward bias. This appears to be a strong short-term play.
The QuantCycle indicator is a technical tool that employs proprietary statistical techniques and complex algorithms to filter multiple cycles from historical data, combines them to obtain cyclical information from price data and then gives a graphical representation of their predictive behavior (center line forecast). Other proprietary frequency techniques are then employed to obtain the cycles embedded in the prices. The upper and lower bands of the oscillator represent a two-standard deviation move from the predictive price band and are indicative of extreme overbought/oversold conditions.


