What generally happens with square outs is once you get it, you’ll never look at charts the same way again, says Jeff Greenblatt, editor of The Fibonacci Forecaster Wednesday.
Last year I started a series of trading strategy articles where I focused on the square out. Uncovering strategies is a lot like peeling an onion. Whether good traders admit it or not, they travel over a thousand miles of nails and broken glass to get a new revelation. One day you might look at a chart a little differently and there will be light where there used to be darkness. Wouldn’t it be great if new revelatory light bulbs went on a little bit more often?
I suppose we should be happy they go on at all.
My upgrade Kairos square out moment hit a little over two years ago. I’ve shared several posts in this space during 2017 about how markets vibrate and square out. They create Kairos moments which means supreme or most opportune moments or points on the chart.
For the most part, the common theme of my examples has been high or low pivots in the market, no matter the time frame. To put this revelation in perspective, W.D. Gann taught this 100 years ago and people are still having trouble with it.
Common wisdom in the Gann community is the $30 stock that squares out will go to 60 in 30 days, weeks or months. Consequently, many believe squaring out is good only for a bygone era. Nothing could be further from the truth as I’ve shown you square outs can and do hit in many different shapes and sizes. They hit in all time frames across the spectrum of financial markets.
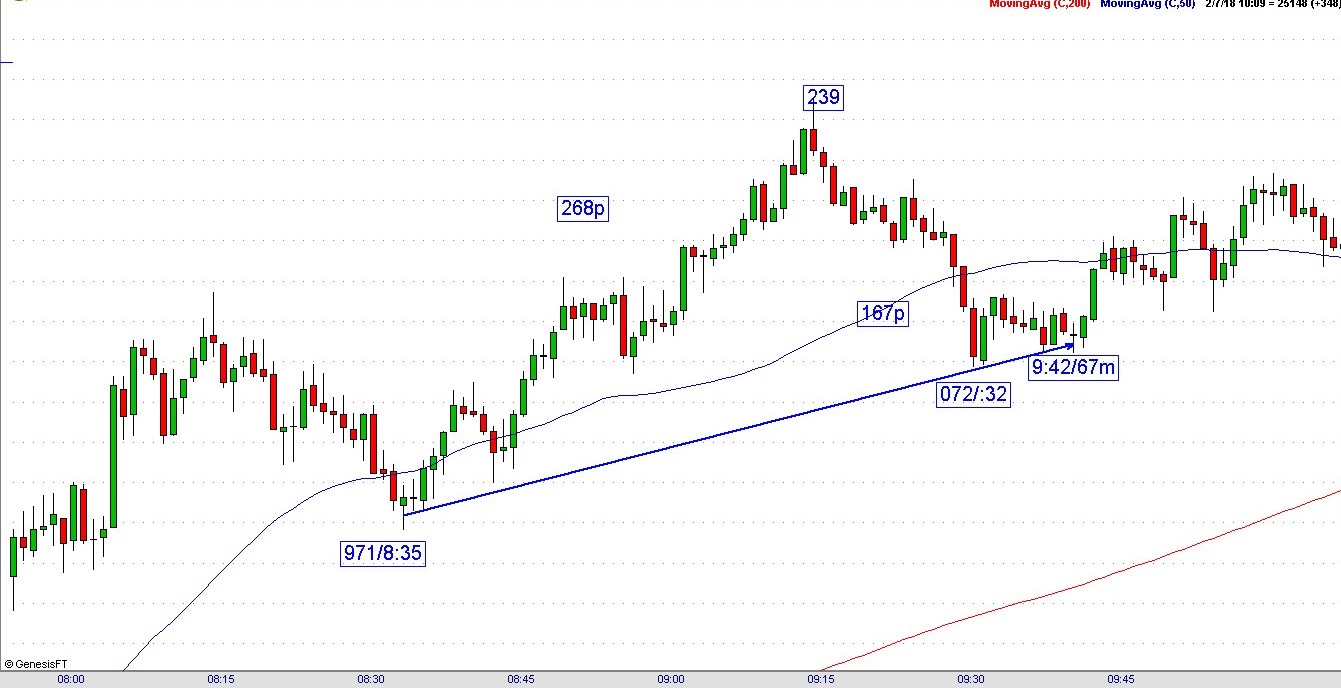
Then I saw how when one particular bar squares out, it becomes a breakout bar. Today’s example is on the 1-minute YM. This sequence begins on the left side, at the 971(24971) where the last leg to a high is 268 points. It corrects downward for 167 points to the 072 (25072) low at 32 minutes after the hour.
Under this methodology, we can say 67-68 is vibrating because the price action doesn’t go any lower, but it doesn’t move. The fact it stayed flat was puzzling until I noticed the candle at 9:42 (MST). That candle was 67 minutes off the beginning of this sequence at 8:35. The next candle started moving and that was the light bulb moment. The significance is the breakout came on the current vibration at 67-68 at it was not the low or high.

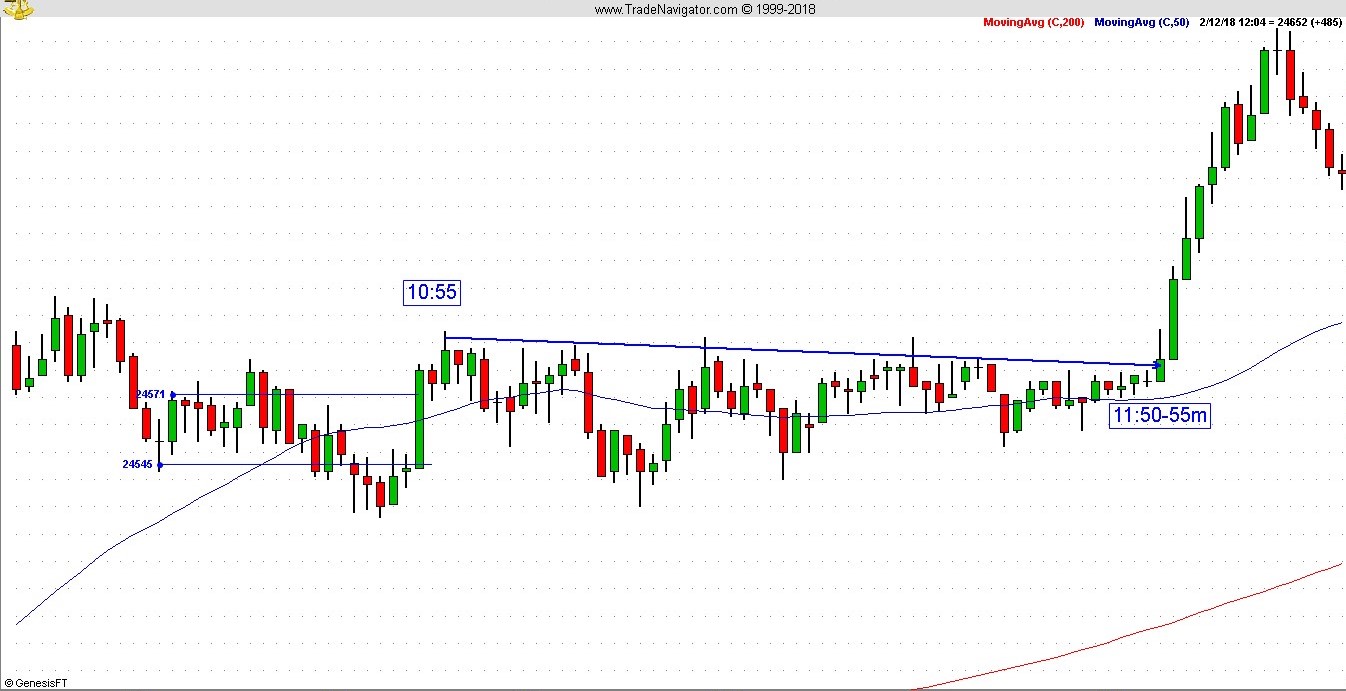
Here is one more recent example where the market hit a high at :55 after the hour. It was a tight, winding consolidation until it squared out at 55 minutes for a great breakout. We can recognize this simple breakout because it didn’t come close to being lower. It turned out to be one of the most important moves of the day.
I’ve named these bars balance bars. In addition to being responsible for breakouts, they also end up becoming future support or resistance bars and can influence the pattern for many bars to come.
Taking it one step further, this condition materializes in many time frames. Consider the 5/15-minute, 30/60-minute as well as daily/weekly. What you see here in a very small time frame is firing off in different time frames all the time. An hourly square out can materialize close to a daily square out which manifests as a choppy pattern.
Some bars are more important than others because they represent the larger time frame. Consider many bars in a standard pattern shift direction as a result of the numerous square outs which develop in the course of the day.
It is best to start simple, moving forward one baby step at a time. Look for patterns like the 55 example where you get a price handle and look out the same number of bars for a reaction. For example, let’s just say we have a high at 131. Look out 31, 131 or even 231 bars. If the high manifests on a daily chart, scale down to an hourly.

Observe what happens. Once the light bulb goes on, practice on a simulator until you get your sea legs. Do not attempt any new strategy in live trading until you totally understand what you are doing. What generally happens with square outs is once you get it, you’ll never look at charts the same way again.


