A thorough review of several trades from past years-both winners and losers-allows for in-depth explanation of the reasoning behind those trades, as well as the entry, exit, and stop levels chosen for each, says technician Tom Aspray.
In my daily Charts in Play feature on MoneyShow.com, I make a number of specific recommendations. Some of these work out, and of course, there are those that do not, but for each trade, I try to give the reader not only the reasons for the recommendation and specific entry levels, but also some guidelines on managing the trades that are executed.
The goal of each article is to provide enough technical evidence so that the reader understands the basis for my conclusions. Still, when it comes to the actual recommendations, there is quite a bit of fine tuning that I'm not able to elaborate on in those articles.
Therefore, it is my hope that a more in-depth look at the strategy behind some of my past trades might provide some additional understanding that could help you become more successful in your own trading.
Figure 1
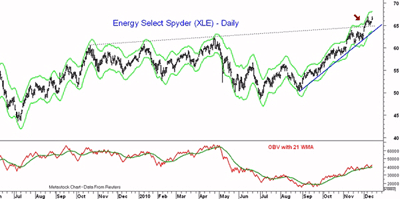
In analyzing a market, my favorite type of set-up is to find a stock or ETF that has just broken out above key long-term resistance or below long-term support. The first trade I would like to break down is a recommendation in the Select Sector SPDR - Energy (XLE) from December 14, 2010.
XLE had broken through year-long resistance at $64.25 on December 1 (see arrow) and closed at $66.46 the day before the article was written.
The hourly chart revealed support from December 8 and 9 in the $65 area with resistance at $67. My recommended buying zone of $65.40-$65.80 represented a pullback of 60%-80% of the range while also including the prior week's open at $65.77. The close-only stop at $60.80 was just below the four-week low of $60.96.
This is a good example of how important the weekly charts are in determining the entry points, as well as the stops and exits. Though I just provide the final recommendation, there is quite a bit that goes on behind the scenes and is often difficult to pass on.
My initial upside target of $71 was the 61.8% retracement resistance level, calculated from the 2008 high at $91.42 to the 2009 low of $37.40.
NEXT: Important Lesson in Adjusting Stops
|pagebreak|Figure 2
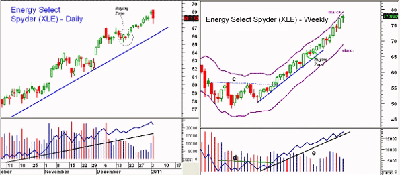
On January 5, I noted that crude oil had reached the top of its trading channel and XLE closed weak on increasing volume (Chart 2a). I therefore raised the stop from $60.96- $66.77 and recommended taking profits on half the position at $69.76.
Since I had over a $3 profit, I wanted to raise the stop so that in the worst-case scenario, I would take a small profit. By recommending selling half at $69.76, I protected against XLE's rally failing below both the psychological resistance at $70, as well as the 61.8% resistance at $71.
Regular readers will realize that I often make a recommendation to sell half of a position when I make my original buy recommendation. The reasons for this are two-fold. First, from a psychological standpoint, taking a profit is always good for your confidence level; and secondly, by selling half your position, you are reducing your exposure so that you have more capital to invest somewhere else. It also can help you to sleep better!
In a February 24 report (chart 2b), I discussed the surge in oil prices and the increased volatility in the energy stocks. I noted that that XLE was very close to the weekly Starc+ band and that the monthly Starc+ band was at $80.25.
I therefore raised the stop from $68.56-$72.72, which was just under the February 9 swing low. I also recommended selling the remaining position at $79.66 or better.
The sell level at $79.66 was just under $80, and if XLE rallied that far, it should be close to its weekly and/or monthly Starc+ band. I have found these bands to be very helpful in determining exit levels. In using Starc bands, you will remember that when prices are at the Starc+ bands, it is a low-risk time to sell and a high-risk time to buy.
I was lucky that during the panic selling of March 15-16, XLE only went as low as $72.90, so the stop held. On March 30, XLE hit a high of $80.37, exceeding the recommended sell level. XLE peaked at $80.97, which was very close to the 127.2% retracement target calculated from the previous correction.
NEXT: What I Learned from a Losing Trade
|pagebreak|Figure 3
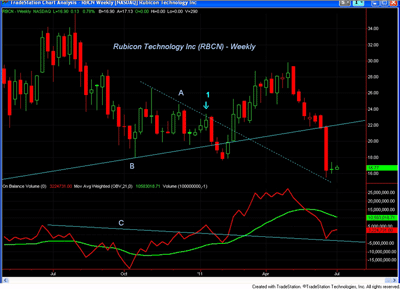
My January 13 recommendation for Rubicon Technology (RBCN) did not turn out as well. The arrow labeled point 1 marks the week when my recommendation was made, as RBCN had closed at $23.24 during the prior session.
RBCN was trading above downtrend on the weekly chart (line A) and the weekly on-balance volume (OBV) had also overcome the resistance at line C. Therefore, I recommended buying RBCN at $22.56-$22.82 with a stop at $19.49.
The buy level represented a pullback from the recent highs and corresponded to the prior swing high from January 5 at $22.77. The stop was under the low from December 21, 2010.
The following day, RBCN opened at $22.81, which filled the order, and RBCN did close the week higher. However, RBCN reversed course the following week and dropped below the lows of the prior three weeks. The stop at $19.44 was hit on January 20.
In hindsight, the highly negative press on RBCN probably made me too bullish, as everyone seemed to hate the stock. This can sometimes work in your favor, but only if your research is completely thorough, and mine wasn't.
Even though RBCN had held the uptrend at line B, in late December, the weekly low in RBCN was lower than the weekly low in late November. This should have kept me out, and also, my stop was more than 10% from my entry.
Typically, I will only accept this high a risk if the stock or ETF is at the Starc- bands or when the market internals have just turned bullish. If I had more closely examined the risk, I would have either lowered my buy level to reduce the risk or have made no recommendation.
NEXT: A Recent Winning Play in Health Care
|pagebreak|Figure 4
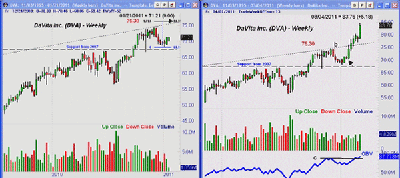
On January 18, my analysis indicated that the health care sector could break out to the upside, and there was one stock, DaVita Inc. (DVA), that I liked. DVA had rallied above the 2007 highs at $67.44 in September 2010 before hitting a high of $74.61 in early December.
The ensuing correction (chart 4a) reached $68.14 and held above the 38.2% support at $67.76. This retest of the breakout level was a very positive sign. The strong close the prior Friday (Jan. 14) at $71.21 indicated that the correction was over. I recommended buying DVA at $70.26-$70.66 with a stop at $67.17 and gave first upside targets at $75.30 and $76.30.
The buy level represented the midpoint to the lower end of the prior day's range. The stop was just under the 38.2% retracement support level. The upside target was determined by the upper trend line resistance at $75.30 and the Fibonacci 127.2% target at $76.30.
In early February, DVA surged above the Daily Starc+ band, so I recommended selling half the position at $76.66 for an 8.5% profit. I also raised the stop to $72.92, which was just under the 50% retracement support level.
On March 7, I noted that DVA had closed at $83.76 (chart 4b), so I raised the stop on the remaining position to $77.33, which was just under the week's lows. Since the uptrend was strong, I did not have any recommendation to sell the remaining position.
On April 18, with DVA closing at $87.04, I raised the stop on the remaining position from $77.33 to $82.22. The June low was $82.51, so we are still long DVA. Using the correction from the May high at $89.58 to the recent low, the 127.2% upside target is at $91.50. Therefore, I would sell the remaining half of this position in DVA at $91.30 or better.
NEXT: A Health Care Trade Gone Wrong
|pagebreak|Figure 5
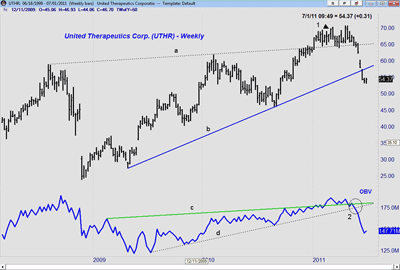
In my March article on DVA, I also recommended United Therapeutics Corporation (UTHR). I noted at the time (see arrow on chart) that UTHR had overcome long-term resistance (line a) in the first week of January (line a). It then traded between $64.50 and $69.48.
The OBV had also broken through its resistance at line c, confirming the price action. The daily chart at the time suggested it was going to break out of its trading range, so I recommended buying UTHR between $67.96 and $68.48 with a stop at $64.27. The order was filled two days later on March 9, when UTHR made a low of $68.32.
The price range from the prior week was $69.87 to $67.54. The midpoint of the range was at $68.70 with the March 2 close at $68.15. The stop was placed under the early- February lows at $64.50.
UTHR declined steadily from the highs an on March 28, dropping as low as $63.88 and hitting the stop. As the updated chart above indicates, UTHR did make marginal new highs at $70.74 after we were stopped out. In May, the break below the March highs was negative. Two weeks later, UTHR dropped sharply. The OBV did not confirm the highs and then gave a sell signal by violating support (point 2).
The loss on the trade was just over 6%, and in hindsight, the only way I might have mitigated the loss was to look more closely at the intraday chart to see if there were signs that UTHR was close to a short-term peak. Occasionally, I do see false upside breakouts in the OBV, and this was one of those times.
NEXT: Why a Recent McDonald's (MCD) Trade Worked
|pagebreak|Figure 6
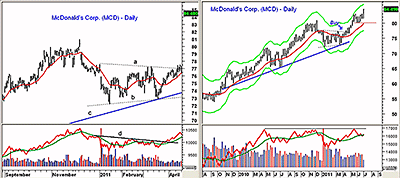
On April 14, I made a recommendation on McDonald's (MCD), which has just broken out of a trading range that was $4.50 wide (chart 6a). The daily OBV had moved through its resistance (line d) in March and was leading prices higher.
For MCD, I recommended buying in two stages because I felt that a stop under the March lows had to be used. For MCD, I advised going 50% long at $76.46 and 50% at $75.54 with a stop at $72.67.
MCD closed the prior day at $76.89 and had a low of $76.50. So my first level was just below the prior day's low and my second level corresponded to weekly pivot support.
The first buy level was hit in the next few days, as the low was $76.40. I also recommended raising the stop to $74.77 on a move above $79.60. The rationale here was that in case MCD failed below the prior high at $80.94 and then reversed, I wanted to reduce the risk on the trade.
On May 19, MCD closed at $81.50, so I raised the stop further, from $74.77 to $78.82. This was just under the May 12 low of $79.11.
In a June 17 article on the restaurant sector, I made a new recommendation for those not long MCD to buy at $81.32 or better with a stop at $78.86 (risk of approx. 3%). MCD got as low as $81.40 on June 23 before it rallied sharply, so the new order was not filled.
The current chart of MCD (chart 6b) shows that MCD is now trading at $84.98 with the weekly Starc+ band at $86.30. The weekly chart still looks strong, as the OBV did confirm the recent highs. Good weekly chart support stands at $80 (red line), so raise the stop now to $79.78.
NEXT: Two Other Recent Set-Ups in Focus
|pagebreak|Figure 7
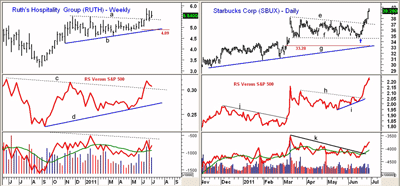
In the June 17 article, I also looked at two other restaurant stocks, Ruth's Hospitality Group, Inc. (RUTH) and Starbucks Corp. (SBUX).
RUTH has one of the patterns I like the best; a breakout from a fairly narrow, well-defined weekly trading range (lines a and b). The relative strength (RS) had also confirmed the breakout and the volume had increased nicely.
Since RUTH had already broken out and was trading at $5.57, I was looking for a pullback to test the breakout level. Therefore, I advised buying at $5.36 with a stop at $4.89.
I often determine the stops using the weekly chart. In May, there were consecutive weekly lows at $4.91, $4.90, and $4.93, so $4.89 seemed like a good stop level. RUTH traded as high as $5.87 on the day the article was released before pulling back the following week to hit a low of $5.27.
I also recommended selling half the position at $6.35 and raising the stop on the remaining position to $5.18. The sell level was determined using the three consecutive weekly highs in May 2010, which were $6.40, $6.30, and $6.60.
If we were fortunate enough to sell half the position at $6.35, it would mean a 18.4% profit on half the position, so raising the stop was prudent from a money management standpoint.
As for Starbucks Corp. (SBUX), the daily chart showed that it was testing the lower boundaries of its three-month trading range in the $34.50-$35 area, line f. The RS and OBV also showed patterns consistent with a continuation pattern.
SBUX closed at $35.14 the prior day, so I was not looking for much of a pullback to buy at $35.08 with a stop at $33.28. Instead, SBUX opened strong at $35.55 and only traded as low as $35.22 during the day. The following day, which was a Monday, SBUX had a low of $35.15, but it closed at $35.83.
Two days after the article, SBUX closed at $36.73, which turned both the RS analysis and OBV clearly positive. SBUX is now trading above $39.
I generally like to buy below the previous period's close. In hindsight, with a volatile stock like SBUX, a better strategy might have been to buy at the highest close of the prior four days, which would have been at $35.22. This level would have been hit, and given its recent rally, paying eight cents hardly seems significant.
My stop at $33.28 is highlighted in red on the chart, as it was placed just under the low from March 7, which was $33.31. I placed it that low because I did not want to get whipsawed if SBUX made one more marginal new low before turning higher.
I hope this look behind the scenes has provided some additional insight into my methods and has furthered your understanding of the markets. In the future, I will attempt to include more of the details behind my recommendations, but please feel free to ask any questions in the comments section below if you have any questions.

