Past market developments are revisited in order to test the theory that changes in implied volatility often precede significant price movements in the equity and/or commodity markets.
Recently, I received an e-mail from a reader asking my thoughts on the below question. I thought it was a great question because it asks me to break down how implied volatility moves, what skew is, and what the predictive qualities of both might be.
“I read somewhere that implied volatility rises when the underlying index future is about to drop such as VIX which went to record levels in market crashes. I also heard something called forward and reverse skew. Forward skew is valid for fast-rising markets such as grains and oil, reverse skew for index futures. Is there any relation between IV rising when underlying about to drop and index futures having negative skew? If we have a commodity with positive skew, will its IV rise or drop when the underlying is about to drop?”
The implied volatility (IV) of an option contract is the volatility of the price of the underlying security that is implied by the market price of the option based on an option pricing model. In other words, it is the volatility that, when used in a particular pricing model, yields a theoretical value for the option equal to the current market price of that option.
See related: Option Volatility Made Easy
Essentially, it is the estimated volatility of a security’s price. Generally, but not always, implied volatility increases when the market is bearish and decreases when the market is bullish. This is due to the common belief that bearish markets are more risky than bullish markets.
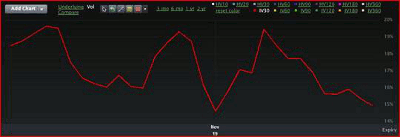
Yes, implied volatility is a complex beast. When the market knows that there is an event coming, we generally will see implied volatility increase. A good example of this was ahead of QE2.
As QE2 was approaching, implied volatility begin to rally (the climb in the pattern below). Once the event happened, implied volatility fell out of the market with haste (the drop off after the final peak). This was a case where IV rallied even though once the announcement came out, the market rallied.
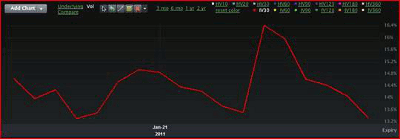
When we are unaware of an event, IV often completely misses the boat, especially when we are in an up market. We saw a rather recent example of this when the Egyptian crisis unfolded last year.
NEXT: How Implied Volatility Missed This Market Selloff
|pagebreak|Just before the market fell off, we saw IVs hit their lowest level in years, and almost immediately, the market tanked about two standard deviations. IV missed the boat on where the market was heading, and in this case, IV was more reactionary than it was predictive (notice that pop that actually happened as SPX was crashing).
In fact, there are those who argue that a really low IV is more predictive of an impending major selloff than higher implied volatility. These traders argue that because IV is so reactionary, by the time volatility rallies to its highs, fear is nearing the end and the market is probably bottoming out.
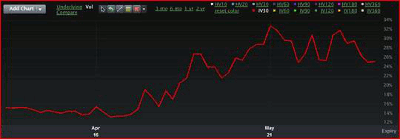
That said, there are examples of IV rising before a major event, like prior to the meltdown of 2008 and the flash crash in May 2010, when we saw implied volatility start to tick up. I would point out that in both of these instances, the market was coming off somewhat low volatility (notice IV start to rise before the crash).
I know this is a long answer to a short question, but generally, at least at a macro level, IV rising is not a great predictor of impending doom, and low volatilites, or vols, might be a better predictor.
Part 2 of the question on skew is correct. I would also call forward skew a commodity skew. Backward skew I would call an investment skew.
Skew is the difference in implied volatility (IV) between out-of-the-money, at-the-money, and in-the-money options. Volatility skew, which is affected by sentiment and the supply/demand relationship, provides information on whether traders and investors prefer to write calls or puts.
NEXT: Understanding the Impact of Skew in Trading
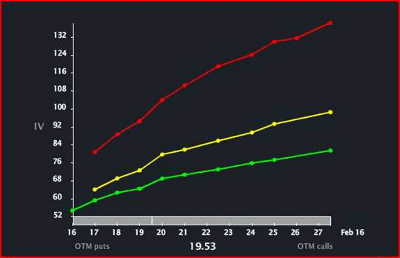
|pagebreak|Skew itself exists for one main reason: supply and demand of those who actually use the commodity. It is all about the hedger. In the case of something like oil, those who buy oil are not afraid of the price dropping; they actually fear a major rally in oil. This creates more demand for calls then puts. Thus, we get a skew that looks like this (VIX skew):
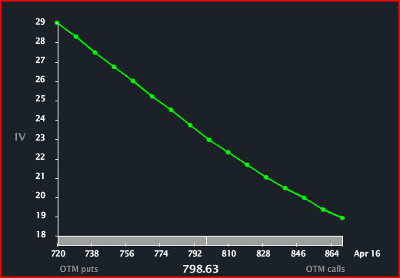
In the equity indexes, most of the world is actually long the underlying security. This creates demand for puts in things like the S&P 500 or the Nasdaq. Often, in order to finance the put purchase, index managers will sell covered calls, creating a collar. Because of collaring, something like SPX has a skew that would like this:
There are other types of skew as well which I won’t get into, but as a general rule, the skew will be determined by who actually needs to hedge the underlying. If you can figure that out, you can figure out the skew.
As far as skew being predictive of an impending selloff, in the case of something like the S&P 500, I have seen some evidence that suggests skew shift is more predictive of a selloff than IV itself.
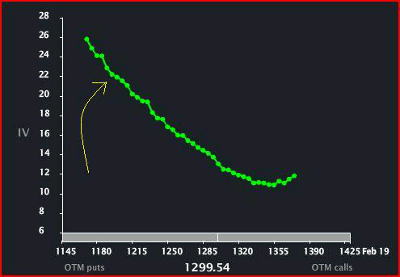
For instance, prior to both the flash crash and the Egyptian crisis, we saw a sharp increase in demand for downside puts in the S&P 500, causing the investment skew to get steeper (more negative) on the downside.
I keep track of skew by tracking what percentage a put is trading over the at-the-money (ATM) volatility (the arrow points how the skew will shift; this is just before a Friday selloff).
Finally, when a commodity is going to sell off, in general, we will see IV actually fall as opposed to rally, unless the move is really violent. It is when the commodity is rising and hedgers are racing to protect themselves that we see that skew increase, or shift upward.
I know this can be a complex subject, but understanding implied volatility can give you some insight and ways to predict future market behavior.
For more instruction about volatility, please read:
By Mark Sebastian of OptionPit.com

