This recent bear call spread has limited risk and will result in a profit if shares of popular retailer Ross Stores, Inc. (ROST) fall slightly this month.
Retailer Ross Stores, Inc. (ROST) was unusually popular among call players last Friday, with roughly 3,200 contracts exchanged—more than six times its average daily call volume. For comparison, fewer than 300 ROST puts crossed the tape. However, digging deeper into the data, it appears the bulk of the activity was attributable to a bearishly biased spread strategy.
The trader who executed the strategy sold several hundred blocks of in-the-money July 80 calls for the bid price of $2.02 apiece, and simultaneously bought an equal amount of out-of-the-money July 82.50 calls for the ask price of $0.80 each.
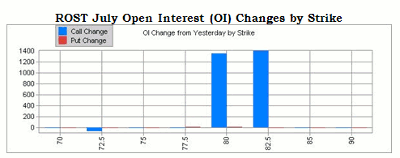
Call open interest at each front-month strike jumped by more than 1,400 contracts over the weekend, confirming that the speculator constructed a bear call spread for a net credit of $1.22 per pair of calls.
The trader's primary objective is for the shares of ROST to finish beneath the $80 level when July-dated options expire, rendering all of the calls worthless and allowing them to pocket the net credit received at initiation.
What's more, the investor can take home at least a fraction of the premium received as long as ROST finishes south of $81.22 (sold call strike plus net credit). On the flip side, the purchase of the 82.50-strike calls caps the maximum risk at $1.28 (difference between strikes minus net credit) should ROST extend its upward momentum beyond the $82.50 level within the calls' lifetime.
From a sentiment standpoint, Friday's bearish options activity is practically par for the course for ROST. During the past ten sessions on the International Securities Exchange (ISE), Chicago Board Options Exchange (CBOE), and NASDAQ OMX PHLX (PHLX), the equity has racked up a put/call volume ratio of 0.99, which in the 75th annual percentile.
In other words, options players have bought to open ROST puts over calls at a faster-than-usual clip during the past couple of weeks.
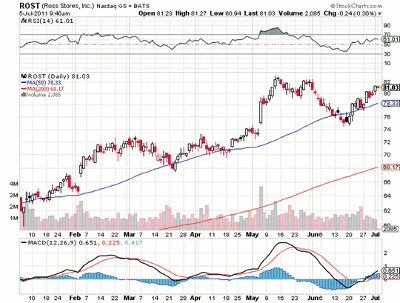
Here’s a daily chart:
By Andrea Kramer, contributor, Schaeffer’s Trading Floor Blog


