Last Tuesday's sharply higher close was spurred by the ECB's monetary stimulus plan, so MoneyShow's Tom Aspray examines the charts to see if the deflationary trend is likely to force EuroZone governments to change their focus on austerity.
It started out as another choppy week for the stock market as last Tuesday's sharply higher close caught me and many others by surprise. As I noted the next day, the market internals did not measure up to the price gains so this made the following days and the weekly close the most important.
Of course, the Tuesday turnaround was spurred by the "European Central Bank's plans for ?1 trillion of monetary stimulus" as the Euro markets rallied in impressive fashion. The Dax Index hit a low last Monday of 9161 and was up 4% by early Wednesday.
However, the surprisingly weak economic data out of the EuroZone and China quickly dampened the market's enthusiasm. This put the markets back on edge, as Wednesday, US stocks closed lower.
On Thursday, the market responded positively to better US data suggesting that Tuesday's upside breakout could be maintained. This supported the more bullish outlook case I outlined last week, though it was not my favored scenario.
The markets got another surprise Friday when the ECB's Draghi commented that the bank must "raise inflation and inflation expectations as fast as possible." These strong comments reflected the urgency of the situation as the Euro markets and the US futures were sharply higher in early trading.
The Chinese then added fuel to the fire as the People's Bank of China cut rates for the first time in over two years. Some economists are skeptical whether this will work, but it extended the Euro markets already impressive gains with the Dax closing up over 5% for the week.
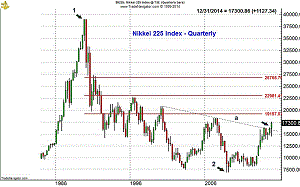
So, what are the central bankers afraid of? This quarterly chart of Japan's Nikkei 225 shows that it peaked in 1989 at 38,957 (point 1). The 2? year plunge took the Nikkei to 14,194 in the 3rd quarter of 1992, which was a drop of 63%.
By the time the NK225 hit 6994 at the end of 2008, it had dropped 82%. The
recent easing efforts, and more importantly the sharp drop in the Japanese yen,
has finally taken the NK225 above the quarterly downtrend, line a. It is still
below the major 38.2% Fibonacci
resistance at 19,197.
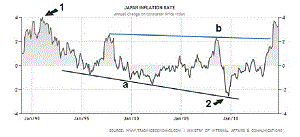
A chart of the annual change in Japan's Consumer Price Index reveals the deflationary trend that has depressed Japanese stock prices for 20 years. The inflation rate peaked at 4% in the early 1990s, and by the middle of the decade, had turned negative.
The inflation rate made a series of lower lows, line a, over the next two decades. The rate finally bottomed out in 2009, point 2, and has been above zero since 2012. The breakout above the resistance at line b, suggests that the long deflationary period may finally be over.
Japan's plan stumbled again earlier this year as they tightened by increasing their sales tax but it appears that they quickly realized their mistake. Therefore, I am not too worried about last week's data showing that the Japanese economy had slipped back into a recession. I expect things to get better next year as the Japanese yen approaches my next target at 125 yen/$.
This emphasizes how difficult it is to change a deflationary trend and this
is what the central bankers fear more than anything. This trend is likely to
finally force those reluctant EuroZone governments to change their focus on
austerity and to support the ECB's stimulus plan.
NEXT PAGE: What to Watch
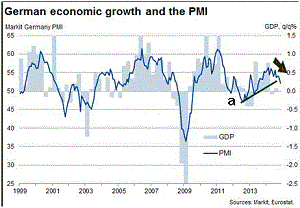
|pagebreak|The Bundesbank and Chancellor Merkel will eventually have to face the reality that their economy is deteriorating along with the rest of the EuroZone. Markit's recent flash PMI data from Germany shows that the uptrend, line a, has been broken. There has been steady deterioration for some time, which suggests the economic data is likely to get even worse before it gets better.
The economic calendar was full last week, but there are a few data points that I think need to be highlighted. The inflation at the producer level came in at 0.2%, which was higher than expected though the consumer price index was flat.
One of my favorite indicators on the housing sector is the Housing Market Index that surveys members about the general economy and housing market conditions. It completed a bottom in the fall of 2011, along with the homebuilding stocks, and rose to 58 in November, which was the best reading of the year.
The Housing Starts were a bit lower last week while the Existing Home Sales did increase slightly. The iShares Dow Jones US Home Construction ETF has rallied sharply from the October lows as it is now testing the highs from early 2014.
There was quite a bit of data last week on manufacturing as Industrial production
and the Empire State Manufacturing Survey were a bit weaker than expected. The
PMI Manufacturing Flash Index also reflected a slower rate of growth over the
past month.
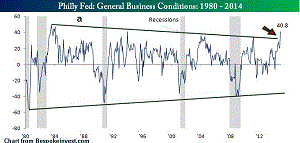
In contrast, the Philadelphia Fed Survey surged to 40.8, almost double the reading from October. The chart from Bespoke Investment Group shows that the resistance going back to the early 1980s, line a, has now been overcome. The completion of the long-term trading range, lines a and b, which, if confirmed over the next few months, will have important implications for 2015.
In this shortened week, there is still plenty of data that could move the markets.
On Monday, we get the Chicago Fed National Activity Index, the Dallas Fed Manufacturing
Survey, and the PMI Service Flash Index.
On Tuesday, we get the second reading on the 3rd quarter GDP, the S&P Case-Shiller Housing Price Index, and Consumer Confidence. Because of the holiday shortened week, we get the University of Michigan's month end reading on Consumer Sentiment, Durable Goods, New Home Sales, and the Pending Home Sales Index on Wednesday.
The markets close early on Friday, but, in the morning, we get the Chicago Purchasing Managers Index.
What to Watch
It was another impressive week in the stock market and some of the weekly divergences
that I have been concerned about have been resolved. Others have not and will
look negative with a lower close this week. The failure of the market to hold
its early gains into the close seems to justify my recent cautious view of the
stock market over the past two weeks. My long-term outlook is still bullish.
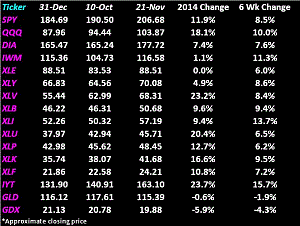
At the beginning of the year, I was again looking for a double digit gain in 2014 just as I was in 2013. Now that the Spyder Trust (SPY) is up over 11% for the year and over 8% in just the past six weeks, it is as important as ever to be aware of the current market risk.
The bullish sentiment, according to AAII, came down a bit last week to 49.12% from 57.93% the previous week. The level of bullishness is still quite high and it does increase the risk. It was one of the reasons, on November 7, I advised not to jump in the market.
So, what is going to happen now? It is possible that the market will continue higher for the next few weeks, though I am getting a bit less confident that stocks will rally the last two weeks of the year. The first sign of trouble will be a sharply lower weekly close, especially one that is below the prior week's low.
I continue to think there are some stocks to buy as two of the four stocks recommend in 4 Small-Caps with Bullish Monthly Volume have now reached their buying zones. And I will be looking at other small-cap stocks that appear to be bottoming as we move into December.
One industry group that should benefit from the renewed interest in the stock market is the brokerage stocks. As I discussed in Will It Be an Early Christmas for the Brokers? they had a strong seasonal tendency to bottom last week. The initial buy levels in the two stocks, Raymond James (RJF) and Charles Schwab Corp. (SCHW) were hit last week. Now we need to see how they perform in the week ahead as there are more trading positions.
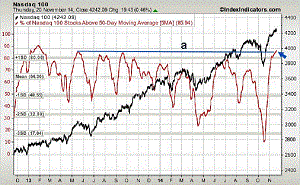
One market tool that I use to measure the risk is the number of stocks in a
major average, like the S&P 500 or Nasdaq 100, that are above
their 50-day MAs. As of Thursday, 85.94% of the Nasdaq 100 were above their
50-day MAs. The May 2013 highs, line a, have been exceeded as the % is over
one standard deviation above the mean. On October 17, the low was 9.70%. Quite
a move.
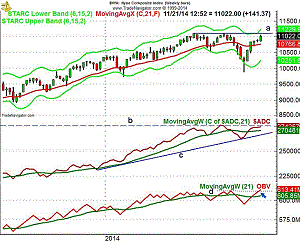
The weekly chart of the NYSE Composite (NYA)
shows the strong close, but it is still below the resistance, line a, and the
July highs at 11,108. The NYSE remains well above the quarterly quarter pivot
at 10,789.
The weekly starc+ band is now at 11,229 with the quarterly projected pivot resistance at 11,340. The 20-week EMA is now at 10,766, which is just below the quarterly pivot at 10,789. The quarterly projected pivot support is at 10,470.
The weekly NYSE Advance/Decline line has moved further above its WMA, but is still below the all time high that was made in late August. With no new high in the NYSE Composite, the weekly A/D line has not formed any divergences.
The weekly OBV is finally acting stronger than prices as it moved above the September highs last week.
The McClellan
oscillator dropped to -9 on Wednesday but reversed into positive territory
on Thursday and improved further on Friday. It will require more positive A/D
numbers to continue higher.
NEXT PAGE: Stocks
|pagebreak|S&P 500
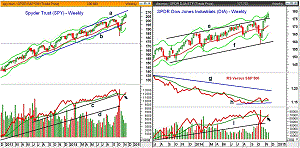
The Spyder Trust (SPY)
moved well above the weekly starc+ band at $206.21 last week and the band has
now risen to $208.82. The high was $207.84, so the monthly projected pivot resistance
at $207.70 was exceeded. The trend line resistance is now in the $209.80 area,
line a.
The weekly range expanded last week and there is two-week support now at $203.13 with more important support at $200. The quarterly pivot is at $196.19.
The weekly on-balance volume (OBV) has moved further above its WMA but has still not made a new high with prices, so a negative divergence may be forming.
The S&P 500 A/D line (not shown) made another new high last week with Friday's
close.
Dow Industrials
The SPDR Dow Industrials (DIA)
has moved further above its trend line resistance at line e. The high was quite
close to the weekly starc+
band, which is now at $179.51 and the quarterly pivot resistance is at $179.48.
The weekly relative performance turned down last week after failing to move above the October highs. A move above this high is needed to indicate it is a market leader.
The weekly OBV has moved back above its flat WMA but is still well below the
highs it made in September. The daily OBV and the Dow Industrials A/D line (not
shown) made further new highs last week and the A/D line is well above its previous
highs.
Nasdaq 100
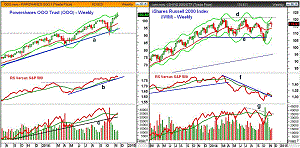
The PowerShares QQQ Trust (QQQ)
also gapped sharply higher early Friday but gave up much of its gains by the
close. The high on Friday was $104.69, which was just below the quarterly projected
pivot resistance at $104.74. This week the starc+ band will be at $105.24.
The weekly RS line continues to make higher highs consistent with a market leader. It is still holding well above the support at line b.
The weekly
OBV has moved above its flat WMA, but not by much, as the volume has been
light over the past three weeks. The daily OBV (not shown) was finally able
to move above the September highs last week.
The daily Nasdaq 100 A/D line made marginal new highs last week and is still holding above its rising WMA.
There is minor support now $102.40-$102.70 with the rising 20-day EMA at $101.71
The September high is at $100.56 and if convincingly broke we could see a decline
to the quarterly pivot at $97.59.
Russell 2000
The iShares Russell 2000 Index (IWM)
formed the third weekly doji in a row and had a low at last week's low of $114.37.
The rising 20-week EMA is at $113.67 with the quarterly pivot at $112.95. A
drop below the $109.50 area would indicate that the rally from the October lows
is over.
The high last week was $118.25 with the weekly starc+ band at $121.
The weekly relative performance broke its downtrend, line f, at the end of October. The RS line is back below its WMA and needs to move above the recent high to complete a bottom.
The daily Russell 2000 A/D (not shown) peaked on November 12 and is still below its WMA, though has turned higher.
The weekly OBV broke through its short-term downtrend, line g, but did turn
lower last week. It is still above its WMA.
NEXT PAGE: Sector Focus, Commodities, and Tom's Outlook
|pagebreak|Sector Focus
The iShares Dow Jones Transportation (IYT)
made further new highs last week as the high at $164.80 easily exceeded the
quarterly projected pivot resistance at $163.49. The weekly starc+ band was
also overcome and is at $167.74 this week.
The weekly relative performance and OBV analysis has confirmed the new highs. The Dow Industrials also made new highs so the Dow Theory is still positive for the market.
The daily studies are positive but have not yet made new highs. There is short-term support now at $160-$160.70 with the rising 20-day EMA at $159.42.
The Select Sector Health Care (XLV)
continues to act well up over 23% for the year while the Select Sector Utilities
(XLU)
is up just over 20%.
The PowerShares QQQ Trust (QQQ) continues to lead the market as it is now up 18% while the Spyder Trust (SPY) has gained over 11%.
The Select Sector Technology (XLK) and the Select Sector Financial (XLF) have continued to edge higher.
The SPDR Dow Industrials (DIA)
gave up ground to the Select Sector Materials (XLB)
last week as the XLB
is now over 2% higher for the year. As I noted recently, the XLB
does have a tendency to
outperform the overall market late in the year.
Interest Rates
The yield on the 10-Year T-Note was pretty flat last week despite the
stimulus efforts and some of the strong economic data. Yields have been in a
range over the past two years despite the recent new stimulus efforts.
Precious Metals
The SPDR Gold Trust (GLD)
and Market Vectors Gold Miners (GDX)
have had impressive rallies over the past few weeks and it has taken prices
back to major resistance. The volume has been strong on the rally so it is possible
that a bottom is forming. The next pullback will tell us more as a bottom has
not been confirmed yet.
The Week Ahead
The failure of the market to hold its gains into the close Friday is another
reason to keep your powder dry. That does not mean that the major averages cannot
still move higher but I still feel the risk in the major averages is high at
current levels.
The high percentage of stocks in the S&P 500 and Nasdaq 100 above their 50-day MAs continues to indicate that the market is in a high risk area, which was not the case in mid-October. The fact that many of the market tracking ETFs have reached or exceeded their quarterly pivot resistance also makes me cautious.
Though we may start a significant correction over the next month or so, I would not change your long-term investment strategy. Everything I watch indicates that the economy and stock market are going to get even better in 2015. I am still recommending that the dollar cost averaging positions should be held as I expect stocks in the US and in the EuroZone to be higher next year.
I will continue to look for low risk opportunities in small-cap and other stocks where there are signs that the stock is just bottoming.
For the first time this year, I would recommend that those who have stuck with their long stock positions all year may consider putting on some light hedges or selling some of their underperforming positions.
Be sure to monitor my Twitter feed for changes in the market outlook as well as new recommendations.
Because of Thanksgiving, the next Week Ahead column will be published on December 5.
Don't forget to read Tom's latest Trading Lesson, Will the Seasonally Strong Sectors Perform?
Here are some of Tom's other recent articles that you might enjoy:
Demand
Success from Your Portfolio
Best
Charts from Successful Investing's Top 14 Picks
Four
IBD Top 50 Stocks on the Way Up

