The talk of a stock market bubble has been bandied about by the financial media pundits this year, but MoneyShow's Tom Aspray sees no signs yet of a stock market bubble but there is another asset class whose bubble may be ready to burst.
Earlier this year, the talk of a stock market bubble has periodically dominated the financial media. Last week, an astute economic reporter even asked President Obama, “Are you concerned there is a bubble out there like we had in ’01 and ’08?” In my view, these debates are stupid and a distraction for investors as there are no signs yet of a stock market bubble.
During my investing career, I have observed three bubbles, the first being the precious metals boom that ended in early 1980 as gold hit a high of $873, having risen from a low of $113 in August 1976. The gold futures rose 66% in just the first four weeks of January 1980.
It was not only the price action that was consistent with a bubble but it was the public clamor to buy the precious metals. Precious metals sales people had great success in selling coins even when they told potential investors they must act immediately.
The dot.com bubble is the most familiar bubble for most investors. I was attending an investment conference in early 2000 where it reportedly took sixty semi-trucks just to bring in the exhibits for the conference. Attendees were buying everything and not even asking for a receipt.
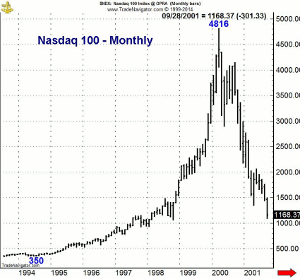
The monthly chart of the Nasdaq 100 shows its rise from 350 in 1994 to a high of 4816 in March 2000. During 1999 and 2000 many stocks moved higher despite weak earnings reports.
Pets.com was one of the darlings of the period and CNET named Pets.com as “one of the greatest dot.com disasters.” During its first fiscal year, ending in September 1999, it reported revenues of $619,000 but spent $11.8 million on advertising. It went public in February 2000 and lost $147 million in the first nine months of 2000. They closed their doors in November 2000.
Now some may argue that this is not unlike some of today’s social media stocks. The difference in 2000 was that almost all stocks were moving higher and those that missed earnings saw single digit losses, not the double digit drops that are frequent in today’s market.
Back then, the public was much more involved in the stock market than they are now. When was the last time someone told you they were quitting their job to become a day trader? Most data indicates that, currently, the public is not nearly as heavily invested in stocks as they were in 2000.
Sentiment was also much different then as, according to AAII, the average bullish reading of individual investors from November 1999 through April 2000 was over 52%. This included a peak reading of 75% in early 2000. Since the start of 2013, the highest reading has been 55% and, as of last Thursday, only 29.4% were bullish.
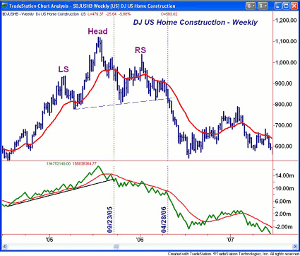
The most recent bubble was in real estate and in the home construction stocks. The weekly chart of the DJ US Home Construction Index shows that it made its high in July 2005. The volume was heavy on the ensuing decline as the OBV broke its uptrend, line b, at the end of September 2005 (line 1).
The OBV stayed below its WMA during the rebound in early 2006, which failed well below the prior highs. This was confirmed by an H&S top at the end of April as the neckline (line a) was broken. This formation was noted at the time on MoneyShow.com.
The other characteristic of this bubble, of course, was the ability to easily get a mortgage you were not qualified for. Many who moved into these much more expensive houses paid well above the asking price, which was common in 2006-2007. This is a characteristic of a real bubble.
So, what bubble may now be bursting? In early June’s column Why You Shouldn't Invest Like a Hedge Fund, I noted the poor performance of hedge funds for many years and expressed my continued amazement that so much money was still flowing into these funds.
The macro strategies—or big bets—that are frequently used by these hedge funds often do not pay any attention to risk, which is why investors should not employ their strategies. Just two weeks ago, the HFR® Global Hedge Fund Industry Report noted that “Investors allocated $30.5 billion of new capital to the hedge fund industry in 2Q14, surpassing the $26.3 billion that was allocated in 1Q.”
But this trend may be changing. Last week the WSJ reported that Calpers (California Public Employees' Retirement System) was altering their hedge fund strategy. They are expected to significantly cut back their allocation to hedge funds.
It was also pointed out that the pension fund for the Los Angeles fire and police employees got out of hedge funds last year. The WSJ quoted Los Angeles Fire and Police Pensions General Manager Ray Ciranna that hedge funds “produced a return of less than 2% over seven years” and “$15 million a year in fees went to hedge-fund managers, 17% of all fees paid by the fund.”
The tremendous inflow may be a bubble as one has to wonder how much longer the ultra-rich and institutions will pay outrageous fees to poorly performing hedge funds. It will be interesting to see how much money moves into hedge funds during the rest of 2014 but Calpers is often a leader amongst the pension funds.
NEXT PAGE: What to Watch
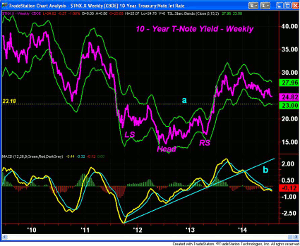
|pagebreak|The stock market held up well last week in spite of the global tensions and while gold was down sharply, the yield on the 10-Year T-Note showed little change. The long-term chart of yields shows the completion of the reverse head and shoulders bottom formation in May 2013.
The neckline support (line a) and the weeklystarc- band are in the $2.30% area. The uptrend in the MAC-D was broken early 2014 which signaled that yields would move lower. The extent of the decline caught me by surprise and the big bond buyers were revealed in last week Bond Market Mystery Solved. There are no signs yet of a new buy signal from the MAC-D and it would take several weeks before one could occur.
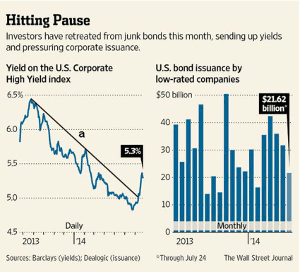
There were interesting developments last week in the junk bond market as the yield on the US Corporate Bond Yield index moved above its downtrend (line a). The yield has risen from under 5% to 5.29% and companies are already acting by issuing less debt. Over the past two weeks, Lipper reports that over $4 billion has been pulled out of junk bond ETFs and mutual funds.
The data on manufacturing from the various Fed regions was mixed and the PMI Manufacturing Flash Index came in at 56.3 while the market was looking for 57.8. There was also conflicting data on the housing market as, while existing home sales picked up sharply, the sales of new home sales plunged. This, combined with weak earnings from some of the home building companies, dropped their stocks below key support.
If this trend continues, it is likely going to dampen the economic recovery. On Monday we get the Pending Home Sales report with the S&P Case-Shiller HPI on Tuesday.
It is a big week for economic data as we also get Consumer Confidence on Tuesday and the FOMC begins its meeting. On Wednesday, the advance reading on second quarter GDP will be watched closely after the dismal final reading on the first quarter. The FOMC meeting concludes on Wednesday afternoon.
Of course, this is also jobs week so we get the ADP Employment report on Wednesday and the monthly jobs report on Friday. Also on Friday are the Personal Income & Outlays, PMI Manufacturing Index, the ISM Manufacturing Index, and the University of Michigan’s final reading for July on Consumer Sentiment.
What to Watch
The new highs in the S&P 500 and Nasdaq 100 last week were not surprising but the weak close Friday if followed by another early this week will suggest a short-term top. This is consistent with the deterioration in the stock market that I have been discussing since early July, Is the Nasdaq 100 Looking Toppy?
The NYSE Composite failed to make new highs while the rebound in the Russell 2000 was quite anemic. If we see heavier selling this week then it will be a sign of a deeper correction within the positive intermediate-term trend.
Since the middle of July, I have felt the risk was getting too high in the overall market and that it was not a time to chase stocks. Last Monday, some of the weekly charts suggested that some stocks had already topped out.
Last week was a big one for earnings as almost one-third reported earnings. There were quite a few that disappointed and were hit hard. Even some who did better than expected only saw small gains. Some of the big tech names were identified to be in high risk zones and Amazon.com (AMZN) was down sharply on Friday after it's earnings.
On the other hand, Facebook (FB) reported very strong earnings and was up 10% for the week.
As I noted earlier, the number of bullish individual investors,according to AAII,dropped sharply last week as most moved into the correction camp. The financial newsletter writers are still way too bullish.
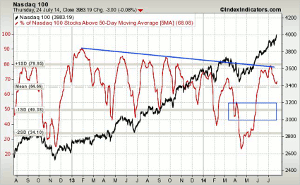
I have been following the deterioration in the five-day MA of the % of S&P 500 stocks above their 50-day MAs for the past few weeks as it appeared to have completed a top formation. This week I thought I would look at the same analysis of the Nasdaq 100.
The 5-day % came close to the 80% level in early July as the downtrend, line a, was tested. It is now trying to turn up from the mean but is likely to turn lower once Friday's data is added in. The Nasdaq 100 will be in a better risk environment if the % dropped into the 42-52% area (see box).
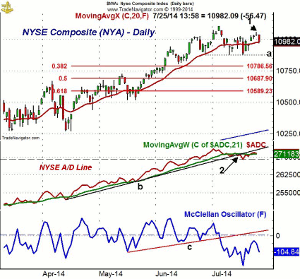
The NYSE Composite (NYA) formed a doji last Thursday (point 1) and then triggered a low close doji sell signal on Friday. The next support at 10,878 corresponds to the twin lows in July, line a.
The quarterly pivot is at 10,758 which is just below the 38.2% Fibonacci support from the April lows. The 50% support level is at 10,687.
NEXT PAGE: Stocks
|pagebreak| The daily NYSE Advanced/Decline did drop below its uptrend, line b, on July 17 (point 2) so last week's rally was treated with suspicion.The A/D line is still above its WMA but a drop below the recent lows (dashed line) would be more negative. It is a good sign that the WMA is not yet declining.
The McClellan Oscillator rallied from its July low of -196 back to -33 last Wednesday before it again turned lower.The rally failed well below the zero line and former support, now resistance at line c. If the NYSE Composite were to drop below its recent low there is the potential for the oscillator to form a bullish divergence.
There is initial resistance at 11,059 and then the monthly projected resistance at 11,207.
S&P 500
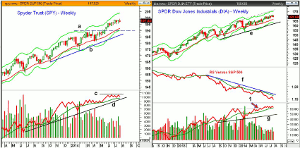
The Spyder Trust (SPY) made another new all time high last Thursday at $199.06 but then gapped lower on Friday. It was pretty much flat for the week but did form a doji the previous week with a low of $195.43.
A close this Friday below this low will trigger a LCD with the monthly pivot at $194.42. There is more important support at $191.24, which is the quarterly pivot. This is just over 3% below Friday's close.
The rising 20-week EMA is at $191.60 with the starc- band at $190.23.
The weekly on-balance volume (OBV) is testing its previous highs and needs a higher weekly close to breakout to new highs as the final close is not in. Still, the OBV has been lagging prices recently after leading prices in early May.
The S&P 500 A/D line (not shown) has held above its WMA throughout July and was trying to turn up again at the end of last week. The A/D line did breakout to a new high on July 21, which was a positive sign.
There is initial resistance at $198.45 with the monthly projected pivot resistance at $199.87.
Dow Industrials
The SPDR Dow Industrials (DIA) failed to make a new high last week and closed just below its 20-day EMA. Last Monday's lows were broken on Friday.
The weekly chart shows a shallow uptrend over the past six weeks. There is next support at $167-$168 with the rising 20-week EMA at $166.21. The quarterly pivot is at $165.45 with the weekly starc- band at $163.73.
The weekly relative performance has continued make lower lows and the long-term downtrend, line f, is well above current levels.
The weekly OBVdid stage an upside breakout in May (see arrow) but is now very close to its WMA. The OBV has more important support at the long-term uptrend. The daily OBV (not shown) did drop below its WMA last week.
Nasdaq 100
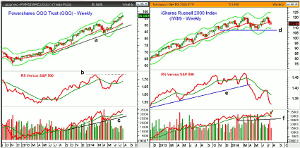
The PowerShares QQQ Trust (QQQ) made another new high last week at $97.51 which was well above the monthly pivot resistance at $96.56. The weekly starc+ band is at $99.27 with the quarterly projected pivot resistance at $101.45.
On the weekly chart, there is first support now at $93.60-$94.20 with the monthly pivot at $92.82. The monthly projected pivot support is at $91.49 with the weekly starc- band at $90.85.
The weekly relative performance just barely moved to a new high last week (line b) but is well above its rising WMA. The daily RS line did confirm the new highs last week.
The weekly OBV also made a new high last week but the daily OBV did form a negative divergence at last Thursday's high. It looks ready to close the week below its WMA and a decline below the lows of the past two week lows would be more negative.
The Nasdaq 100 A/D line made its high July 3 and again failed to make a new high last week. It did rally nicely after making new lows for the month and is now back above its WMA.
Russell 2000
The iShares Russell 2000 Index (IWM) also gapped lower on Friday to close the week below the quarterly pivot at $115.05. A drop below the recent low at $112.20 could signal a decline to the quarterly projected pivot support at $110.78.
The declining 20-day EMA, now at $115.13, was just tested on last week's bounce which is characteristic of a rebound within a downtrend. There is further resistance in the $116.50-$117.50 area.
The Russell 2000 A/D is now very close to making new correction lows.
The relative performance plunge through support in April (line e) was a strong signal that the small-caps were no longer a market leading sector.
The weekly OBV is also now below its WMA while the daily OBV is close to making new correction lows.
NEXT PAGE: Sector Focus, Commodities, and Tom's Outlook
|pagebreak|Sector Focus
The iShares Dow Jones Transportation (IYT) made another new high last week as the monthly projected pivot resistance at $151.45 was exceeded with last Thursday’s high of $152.40.
There is next support at $150 which was the recent breakout level with longer-term support at $145.88 and the monthly pivot.
The RS analysis continues to indicate that this is market leading sector. Both the weekly and daily OBV made new highs last week so the OBV multiple time frame analysis is still bullish.
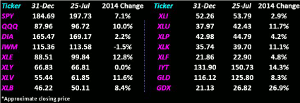
The energy ETFs had a nice bounce last week but the Select SPDR Energy (XLE) is still locked within the trading range I discussed last week. It is showing nice double digit gains for the year.
The Select Sector Utilities (XLU) and Select SPDR Health Care (XLV) are both up well over 11% while the Select SPDR Consumer Discretionary (XLY) is just slightly negative for the year.
The Select Sector Financials (XLF) was flat for the week as my recent analysis did not make a convincing case that the big bands were becoming market leaders.
The Select SPDR Technology (XLK) did break out to convincing new rally highs and is now up 11% for the year.
The PowerShares QQQ Trust (QQQ) continues to lead the Spyder Trust (SPY) by almost 3%.
Crude Oil
The September crude oil pushed above the $103 level but then closed just below $102 as it was flat for the week. The volume on the upside two weeks ago was heavy which should be a bullish sign.
Precious Metals
Both the Market Vectors Gold Miners ETF (GDX) and the SPDR Gold Trust (GLD) had a choppy weak but did hold well above the prior week’s lows. They rebounded nicely from last Thursday’s drop but are still locked in their trading ranges.
The Week Ahead
More new rally highs are still possible this week but will need to be watched closely. I would need to see the NYSE A/D begin a convincing new uptrend before I become a more aggressive buyer. At a minimum, that will require several days of good A/D numbers.
Conversely, a couple of consecutive down days could push the daily studies firmly into the sell mode. That would mean a deeper correction of 3-5%. This is still the slightly favored scenario as I do not see many stocks that look attractive on the long side. (Editor’s Note: Last week, the 50% correction was meant to be a 5% correction.)
The bottoming formations in some industry groups like the homebuilders have been aborted so the focus should continue to be on the risk. Some sector ETFs are quite near to their quarterly pivots which would be a negative sign (see These Are the Real Levels to Watch).
For those who are still in the process of a dollar-cost-averaging plan, I would definitely stick with your plan.
For stock traders, I continue to advise a cautious approach to new buying until the market is in a lower risk environment.
Don't forget to read Tom's latest Trading Lesson, Finding High-Probability Entry Levels.

