Recent choppy market action promises a bumpy summer ahead, so MoneyShow's Tom Aspray offers a simple strategy that will allow you to enjoy a stress-free season while keeping you in the game.
Investors came back from the long weekend ready to buy as the S&P 500 closed above the 1900 level in impressive fashion. Nevertheless, many analysts and TV pundits still point to the number of reasons why stocks should not be this high and can't go higher.
The environment has also been difficult for individual investors as the choppy action in the S&P 500 and the wide swings in the Nasdaq 100 have made them difficult to trade. Clearly, the broad market has been in a non-trending mode, but it is still possible to find and buy stocks that are trending.
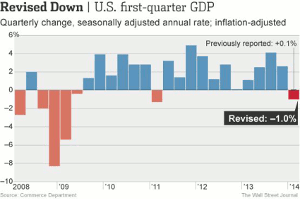
Last Thursday's preliminary reading on 1st quarter GDP was worse than expected at -1.0% but stocks still closed the day higher, further confounding the market bears The final reading for the 1st quarter will be released on June 25, and I would not be surprised to see it revised upward.
Certainly, buying the averages at current levels has too high a risk, in my opinion, as one needs to use a very wide stop. However, there are quite a few stocks that appear to have just bottomed and look attractive on a slight pullback. Three such consumer stocks were discussed last week in Betting on the Consumer.
Still, there are many investors who are uncomfortable with individual stocks especially after the recent wild earnings seasons, which has driven both fundamental and technical analysts nuts. For example, Abercrombie & Fitch Co. (ANF) reported that it lost less than expected and its stock finished the day up 5.75%.
The summer months are typically even choppier but after the last five months this may not be the case this year. Still, summer is a time for many to focus on their families and not worry about their investments. Those who decided to sell at the start of May may be wondering if they should get back in as the S&P 500 has gained almost 2%.
In this week's column, I will be focusing on using a dollar cost averaging approach to establish positions in three very diverse ETFs. This is a good approach for those who are not invested in the stock market, as well as those who would like a lower stress investment strategy during the summer months.
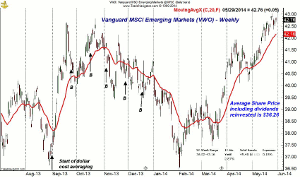
In August's A Contrary Bet for 2014?, I recommended this approach for the Vanguard FTSE Emerging Markets ETF (VWO) starting on September 3. Six equal investments were made every three weeks (see arrows on the chart) with the final investment made on December 17.
Of course, the advantage of this approach is it makes it less likely that one will buy at the market high, which often happens to individual investors. With the reinvestment of dividends, the position is now up almost 18%. The chart is now looking quite bullish, so it may indeed turn out to have been a good contrary play for 2014.
A similar strategy was recommended on January 10 in either a S&P 500-tracking ETF or fund. The amount invested will depend on how much exposure you want to have in the equity markets and also how you personally react when the Dow Industrials has a daily drop of 100 or 200 points. We are likely to have several such days before the end of the year, and if such a drop is going to ruin your summer vacation, invest less.
For those who are not invested in stocks at all, a 30% commitment to these three ETFs does not seem unreasonable. That would be 10% in each fund that would be made up of five separate investments every three weeks. Starting on June 2, subsequent investments would be made on 6/23, 7/7, 7/28, and 8/18.
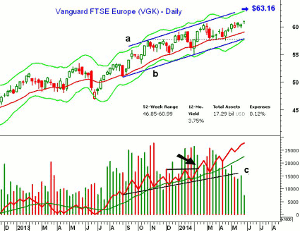
All of these three ETFs have been recommended previously and the top choice is the Vanguard FTSE Europe (VGK). As indicated on the chart, it has a current yield of 3.75%, which is better than a 30-year US T-Bond and has a low expense ratio of 0.18%.
This data is courtesy of Morningstar, which has a wealth of information on VGK, as well as the other ETFs. For example, it has a total of 505 stocks with the largest position a 2.65% stake in Nestle SA ADR (NSRGY). The chart shows a well-defined bullish trading channel (lines a and b) and the OBV broke out to the upside in February. The quarterly pivot resistance is at $63.16.
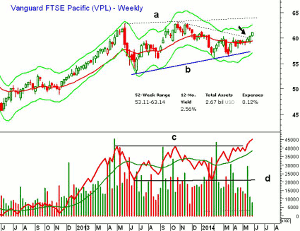
Another favorite is the Vanguard FTSE Pacific (VPL), which also has a nice yield of 2.56%. It has 818 stocks with the largest holding (2.57%) in Toyota Motor Corp. (TM). Like all Vanguard ETFs, the expense ratio is quite low at 0.12%. In addition to 56.4% of its holdings in Japan, it has 19.3% in Australia, 11.3% in Korea, 8.9% in Hong Kong, and 3.7% in Singapore.
The weekly downtrend was broken two weeks ago (see arrow) but the broader trading range is still intact (lines a and b). The OBV has already broken through its corresponding resistance at line c, suggesting that the OBV is leading prices higher.
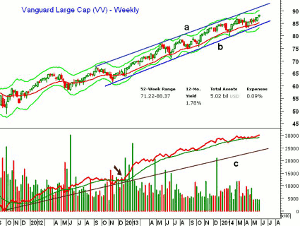
The final recommended ETF is the Vanguard Large Cap ETF (VV), which has a yield of 1.79% and an expense ratio of 0.09%. It has over 80% in mega- and large-cap US stocks and 669 stocks in total. The largest holdings are a 2.9% stake in Apple Inc. (AAPL) and 2.4% in Exxon-Mobil (XOM).
The chart has been in a solid uptrend since late 2012 and VV was up 32.7% in 2013. The OBV staged a strong breakout in early 2013 and has made a series of higher highs with the weekly starc+ band now at $90.20.
NEXT PAGE: What to Watch
|pagebreak|The other major market news last week was the further rally in the bond market and the sharp drop in gold prices, which I warned about several weeks ago. For more details, see page 4 of this article.
In contrast to the GDP report, most of the other economic news was better than expected including the Durable Goods, PMI Flash Services Index, and the S&P Case-Shiller Housing Price Index.
At the end of the week, the Chicago PMI reflected strong growth in the region while the month ending reading on Consumer Sentiment fell slightly to 81.9 from April's 84.1 reading.
We have a full calendar this week especially when it comes to the manufacturing sector. On Monday, we get the PMI Manufacturing Index, the ISM Manufacturing Index, and Construction Spending. This is followed on Tuesday by Factory Orders.
This is another jobs week so we get the ADP Employment Report on Wednesday, along with Productivity and Costs, followed by the ISM Non-Manufacturing Index. The monthly jobs report will be out Friday morning.
What to Watch
The outlook for the market has certainly
changed in the past two weeks. In hindsight, it seems as though my more cautious
approach in the last Week Ahead
column just meant that the trading range was going to be resolved sooner
rather than later.
On May 21, two of the technical studies suggested the market rebound had failed but it was not confirmed by the price action, as the major averages closed above their key levels. Nevertheless, stops were raised in the Spyder Trust (SPY) and the PowerShares QQQ Trust (QQQ).
The confirmed upside breakouts suggest the surprises may be on the upside, though there should continue to be pullbacks along the way. The minor support for the S&P 500 is now in the 1900 area, with the monthly projected pivot support for June at 1880.
Once again, the oversold reading from the Arms Index helped us identify the market lows.
The continued low readings of the VIX are being used by many as a warning sign, but one of the foremost experts on the VIX, Larry McMillan, interprets its action as bullish.
The individual investor turned a bit more bullish recently, as the bullish percentage is up to 36.4%, but a higher percentage is now neutral at 40.3%. With the market at new highs, having only 36.4% bullish, I think, is positive sign.
The five-day MA of the % of S&P 500 stocks above their 50-day MAs finally has completed a bottom formation, as indicated by line a. Only a drop back below 48% would negate this and the percentage could rise as high as 79-82%.
For the Nasdaq 100, the drop below 5% (see arrow) was pretty amazing, as I thought we might get a short-term pullback, but instead, it has risen sharply. It is now just below the mean of 60% and could move back to the 78% level before the market reaches a high risk zone.
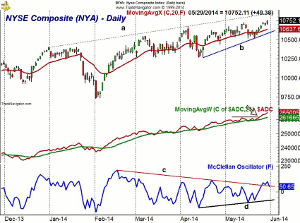
The daily chart of the NYSE Composite (NYA) shows the impressive rally of the past week or so. The NYSE held May's monthly pivot at 10,522 before exploding to the upside. The upper trend line (line a) is now at 10,850 with June's projected resistance at 10,907. The quarterly pivot resistance is at 11,087.
The rising 20-day EMA is at 10,637, with the June monthly projected pivot support (courtesy of John Person's software) at 10,590. This also corresponds to the short-term uptrend, line a.
The NYSE Advance/Decline made an impressive move to new highs last week, as it is well above its previous peaks and its rising WMA. The weekly A/D line (not shown) has also made a new high.
NEXT PAGE: Stocks
|pagebreak|The McClellan oscillator broke through its longer-term downtrend, line c, last week. It pulled back Friday as the A/D ratios were flat. It has major support now at line d.
S&P 500
On the daily chart of the Spyder
Trust (SPY)
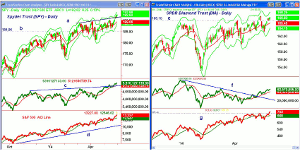
you can see that the resistance, at line a, has been decisively overcome. There
is additional resistance in the $194 area with June's projected pivot resistance
and the weeklystarc+
band in the $196.30 to $196.77 area.
t was a positive sign that the SPY never closed below the May 7 low of 186.01 and this set the stage for the recent rally. The monthly pivot and first support is now at $190.25 with the 20-day EMA at $189.56.
The daily on-balance volume (OBV) has broken through its resistance from last fall, line c, and made another new high last week. As I tweeted last Tuesday, the weekly OBV had broken out to the upside before the long weekend.
The daily S&P 500 A/D, like the NYSE A/D line, made a convincing new high last week and is acting stronger than prices. It is well above its rising WMA.
Dow Industrials
The SPDR Dow Industrials
(DIA)
is now testing the May 13 high at $166.86 with the daily starc- band at $168.21.
The monthly projected pivot resistance is at $169.36 with the weekly starc+ band
at $171.26.
Though the daily OBV has broken its downtrend, it is still well below the late 2013 high and therefore diverging from prices. The weekly OBV (not shown) has confirmed the price action.
Both the weekly and daily relative performance have dropped sharply in the past two weeks, aborting the bottom formation. This suggests that they are no longer market leaders but I still like the majority of large-cap, high yielding stocks in the Charts in Play portfolio.
The daily Dow Industrials A/D line did make a new high and has confirmed the price action.
The 20-day EMA is at $165.43, which is quite close to the monthly pivot at $165.48. The monthly projected pivot support is at $164.09.
Nasdaq-100
The PowerShares QQQ Trust (QQQ)
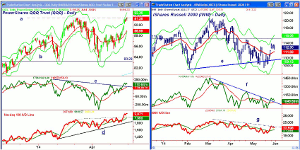
did exceed the March 7 high at $91.15 (line a). It has rallied very sharply in
the past eight days and is well above its rising 20-day EMA at $88.99. The
monthly pivot is at $89.38 with more important support at $86.58.
The weekly starc+ band is at $92.89 with the monthly projected pivot resistance at $95.16.
The daily OBV has surpassed its downtrend, line c, but is still below the highs from earlier in the year. The weekly OBV is above its WMA but is also below its all-time highs.
The Nasdaq 100 A/D is acting much stronger as it has moved well above its previous highs and has been acting stronger than prices. The uptrend, line d, was tested and held before the recent sharp rally.
Russell 2000
The iShares Russell 2000
Index (IWM)
has had a more anemic rally as it has still not been able to move above the
quarterly pivot at $114.53. The rising 20-day EMA is at $111.66 with the monthly
pivot now at $111.26.
The daily OBV was just barely able to break its downtrend, line f, while the weekly has been able to move above its WMA. It is still below its previous peak.
The Russell 2000 A/D has just rallied back to its downtrend, line g, but it is encouraging that its WMA is now rising.
NEXT PAGE: Sector Focus, Commodities, and Tom's Outlook
|pagebreak|Sector Focus
The iShares Dow Jones
Transportation (IYT)
has continued to accelerate to the upside as it is up over 10% for the year. The
quarterly projected pivot resistance at $143.81 has been exceeded. For June, the
monthly projected pivot resistance is at $146.58 with the weekly starc+
band now at $147.64.
The weekly and daily relative performance are still clearly positive and confirming the price action. There are also signs that IYT is starting to trend higher.
There is first good support now in the $139.60 to $140.90 area.
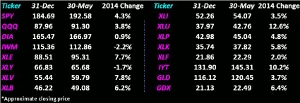
A dramatic change in the yearly performance table over the past two weeks as only the iShares Russell 2000 Index (IWM) and Select SPDR Consumer Discretionary (XLY) are still in negative territory for the year.
The Spyder Trust (SPY) is up over 4% for the year while the SPDR Dow Industrials (DIA) is up less than 1%. The PowerShares QQQ Trust (QQQ) is now up 3.8% for the year as its rally had been impressive.
The Select SPDR Utilities (XLU) corrected sharply from the early May highs as expected. It has rallied with the overall market and is up over 12% and still leading the sector ETFs. The Select SPDR Energy (XLE) has moved above the early May highs and is up 7.7% for the year.
The Select SPDR Materials (XLB) has also done pretty well as it is up 6.2%, which is a bit behind the 7.8% gain in the Select SPDR Health Care (XLV). Even the typically defensive Select SPDR Consumer Staples (XLP) is up 4.8%.
Bond Market
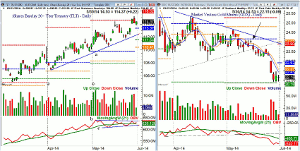
The 10-year T-note yield dropped further last
week, but bounced late Friday to close just above the strong support at 2.47%.
Nevertheless, there are no signs yet that rates are bottoming, with the daily
starc- band now at 2.390%. The chart of the iShares Barclay 20+ Year
Treasury (TLT)
shows that it tested the monthly projected pivot resistance at $114.63 last week
before turning a bit lower. The daily OBV has not yet confirmed the new highs,
line b, but needs a drop below support, at line c, to turn negative. Key chart
support is now at $111.52.
Crude Oil
Crude oil attempted to move above the prior
week's high, but the rally failed, as it closed the week down $1.60 per barrel.
The weekly studies are still positive with monthly pivot support for the June
contract at $102.06. There is longer-term support still in the $99.50-$100
area.
Precious Metals
In the May 14 "Gold Miners Fail
to Launch," I did not like the action and recommended closing out the
long positions in Market Vectors Gold Miners ETF (GDX)
for a small profit.
As the chart shows, GDX has lost almost 5% since, and the SPDR Gold Trust (GLD) has also dropped sharply. The OBV broke support ahead of prices, which was a good reason not to be long. There are no signs yet of a bottom.
The Week Ahead
Though we were getting a bit more
cautious two weeks ago, we did not change our strategy and stayed with the
majority of our long positions.
We are still long both the Spyder Trust (SPY) and PowerShares QQQ Trust (QQQ) as both have now made new yearly highs. I have been adding stocks to the portfolio and the Consumer Discretionary appears to have bottomed. The key test will be the strength of any rally after a pullback. The homebuilders are part of this sector and I will take a technical look at them in the coming week.
Lots of economic reports this week, including the widely watched jobs report, but still, I think initiating dollar cost averaging positions for the three featured ETFs is a good idea, even if you are not currently in the market.
I will also be updating the Charts in Play portfolio as, after last week's rally, I want to raise some stops and lock in some nice profits.
I would take some time this weekend to see what stocks in your portfolio are not keeping pace with the market. If you see signs of deterioration in any individual issues, take the appropriate action.
Don't forget to read Tom's latest Trading Lesson, Picking Stocks in Non-Trending Markets.

