Given the recent market volatility, many traders may not be feeling much Valentine’s Day love, but MoneyShow’s Tom Aspray takes a technical look at some familiar patterns that might lead to promising opportunities.
It is a common view that traders, generally, like volatile price action, because they are able to take advantage of the sharp price moves that often take place in a brief time span. Some do not realize that traders look for familiar patterns during the volatile periods that can provide the best opportunities.
After the past two weeks, I doubt many are feeling much Valentine’s Day love for the market and are glad they have a three day weekend. The plunge on February 3 supported the view of many market bears, while those who were not short expected a day or two of consolidation, or a weak rebound, before the market decline resumed. Ideally, they would get a sharp two-day rally that would stall on the third day below the 20-day EMAs and this would give them an opportunity to get short.
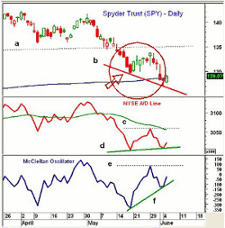
The stock market bottom in June 2012 is an example of typical pattern, as the Spyder Trust (SPY) retested its highs in early May, before dropping sharply to the May 18 low of $126.06 (see arrow). The SPY then rebounded sluggishly for the next seven days and came close to the 20-day EMA at $130.56. It was also unable to move above the 38.2% Fibonacci retracement resistance before the SPY turned lower. It eventually dropped to a low of $123.72 in early June, which was accompanied by the formation of bullish divergences, as shown on the chart.
Some may have been looking for a similar setup this time, as stocks did stabilize after the February 3 plunge, but just two days after the Wednesday low of $173.71, the SPY had already closed above its 20-day EMA, as well as both the 38.2% and 50% retracement resistance. Those stubborn bears that held onto their positions until last week were probably stopped out last Tuesday or on Thursday’s surge. Many who, understandably, were looking for a more serious and long lasting decline were disappointed.
As of last Friday’s close, there had been significant improvement in many of the technical studies but there was not enough evidence then to confirm that the correction was over. The further improvement by the middle of last week indicated that the worst of the selling was over.
It was the weak manufacturing data out of China that started to spook the markets last month. As was reported by Reuters on January 23, “Activity in China's factory sector contracted in January for the first time in six months.” Stocks closed lower that day and the market gapped lower the following day.
Economists and analysts are often skeptical about the data out of China, so while the 10.6% jump in January exports may have boosted stocks, many were still skeptical. It seemed to conflict with the weaker data out of South Korea and Taiwan. Of course, investors should never change their strategy based on a headline or a few data points, as emotion is an investor’s worst enemy.
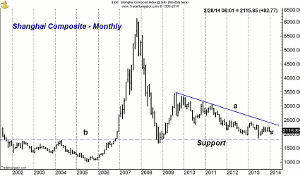
Despite the doom and gloom over China, the weekly chart of the Shanghai Composite shows that it is currently trading well above the 2013 lows of 1850. It is also above the longer term support from 2004 that is in the 1800 area, line b. A strong close above the weekly downtrend at 2400, line a, would be a good sign.
NEXT PAGE: What to Watch
|pagebreak|The news out of the Eurozone continues to signal further improvement in their economies, as Friday’s report on 4th quarter growth beat expectations. Economic leaders Germany and France reported 0.3% growth that was better than expected, with the Netherlands up 0.7%. Germany also raised its growth forecast for 2014 to 1.8%.
Spain and Portugal are also doing much better than expected, with growth rates of 0.3% and 0.5% respectively. Their long depressed real estate markets are also getting much attention, as Spain saw a dramatic increase in its commercial property investment in 2013. They reported that 4.98 billion euros were invested, which was the first increase in the past four years. The UK property market has drawn the most interest, as it made up 39% of sales. Estimates are that over 40 billion euros of European real estate loans could go on the market in 2014.
The US economic data last week was pretty much ignored by the stock market, though it did drop briefly on Thursday’s weaker than expected Retail Sales data. The sales were down 0.4%, with most expecting only a decline of 0.1%. Friday’s Industrial Production showed a 0.3% decline, while most economists were expecting a 0.3% growth.
The week ended with the better than expected Reuters/University of Michigan reading on February consumer sentiment, which came in at 81.2, which was better than expected.
Though the markets are closed Monday, this week’s economic calendar is quite full. On Tuesday, we get the Empire State Manufacturing Survey along with the Housing Market Index. The Housing Starts are out Wednesday and, given the weather, another decline, like last month, would not be surprising.
The Producer Price Index is out Wednesday and is followed by the Consumer Price Index on Thursday. Also out on Thursday, in addition to jobless claims, is the PMI Flash Manufacturing Index , the Philadelphia Fed Survey, and Leading Indicators. The Existing Home Sales for January are scheduled to be released on Friday.
What to Watch
It was an impressive week for the stock market, and, even though I was expecting an increase in bearish sentiment to create a buying opportunity, the turnaround was even faster than I thought. In addition to frustrating traders, it also likely left many investors on the sidelines, as the panic selling kept them from buying.
As I mentioned last week, the ability of the Spyder Trust (SPY) to stay above its quarterly pivot at $177.97 on a weekly closing basis was a good sign for the market. The SPY has already exceeded its monthly projected pivot resistance and looks ready to join the Powershares QQQ Trust (QQQ) in making new highs.
There are some ETFs that closed below their quarterly pivots on the market correction, while others, like the iShares Dow Jones Transportation (IYT), did not. In last Monday’s column, Quarterly Pivot Winners & Losers, I reviewed the ETF’s status and provided an updated table. Those strongest ETFs should continue to be the market leaders.
In Wednesday’s technical review, I noted that the 5-day MA % of S&P 500 stocks above their 50-day MAs had turned up from the 30 level, consistent with a market bottom. It closed Thursday at 48% and is still below the mean of 63.92%.
Unfortunately, the sentiment has also turned around, as I would have liked it to get more bearish. The number of bullish individual investors has risen from 27.9% to 40.15%. The % of bears took a big hit, also dropping 9%.
The weekly technical studies are bullish and they do suggest that the correction is over. As I discuss below, the only lagging indicators currently seem to be the daily on-balance volume (OBV) readings, as the advance/decline lines are acting strong.
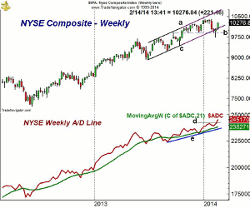
The weekly chart of the NYSE Composite shows the drop below the November and December lows (line b) two weeks ago, and then, the strong rebound. This low at 9738 now becomes an important level of support.
The NYSE is still below the January high at 10,406.77 with the weekly starc+ band at 10,580. The upper boundary of the trading channel (lines a and c) is now at 10,666.
NEXT PAGE: Stocks
|pagebreak|The most bullish development last week was the convincing new highs in the weekly NYSE Advance/Decline, as it overcame the resistance at line d. This reinforces the major bullish trend, as it has since 2009. Just last month, it moved out of the trading range that had been in effect for a good part of 2013. The A/D line has good support at its rising WMA and its uptrend, line e.
The NYSE reached its monthly projected resistance at 10,280 on Friday, with the monthly pivot and 20-week EMA now at 10,100. This should be first good support with stronger at 9900.
S&P 500
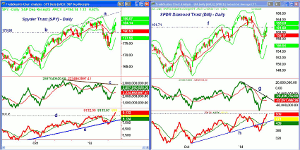
The Spyder Trust (SPY) has had an impressive reversal from the February 5 low, as the drop last Thursday to $180.83 was well supported. The close was well above the monthly projected pivot resistance at $183.12, which now becomes first support. The 20-day EMA has turned up and is now at $180.53 with further support at $179.86.
The daily starc+ band is now at $186.06 with the weekly at $188.56.
The daily on-balance volume (OBV) has moved well above its WMA, which is now trying to turn up. It is still well below the bearish divergence resistance at line c. A move above the January high would be positive. The weekly OBV (not shown) is back above its WMA as Aspray’s OBV Trigger (AOT) has flipped back to positive.
The S&P 500 A/D line slightly broke its uptrend, line e, on the correction, but moved to new bull market highs last week, as it is now well above the December-January highs at line d.
Dow Industrials
The SPDR Dow Industrials (DIA) has also had a nice rebound but, so far, has just reached the prior support, now resistance in the $161.71 area. The monthly projected pivot resistance is at $162.74 with the daily starc+ band at $163.04.
The close last week was back above the quarterly pivot at $159.26.
The daily OBV is just breaking its steep downtrend, while the weekly OBV is still below its WMA.
The Dow Industrials A/D line dropped well below its support (line h) in early February, but did hold above the December 2013 lows, before reversing. It was strong last week and is not testing the previous highs.
Nasdaq-100
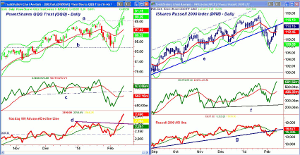
The PowerShares QQQ Trust (QQQ) hit a correction low of $83.74 and tested the quarterly pivot at $84.04 before reversing sharply. A HCD buy signal was triggered the following day as QQQ has proven itself on the upside by closing well above the January highs, line a, last Thursday. It added to the gains on Friday with the daily starc+ band at $91.18.
The chart has first support now at $88.30 with the rising 20-day EMA at $87.13. The daily starc- band is at $86.32.
The daily on-balance volume (OBV) has moved back above its WMA and the resistance at line c. It did make new highs in January, but is still well below these highs. The weekly OBV (not shown) is very close to making new highs.
The Nasdaq 100 A/D line has risen sharply over the past seven days, as it closed the week well above the previous highs and the resistance at line d. A pullback in the A/D line of 1-3 days should create a good buying opportunity.
Russell 2000
The iShares Russell 2000 Index (IWM) is still lagging both the QQQ and SPY as it closed the week back at its former uptrend, line e. IWM dropped last Thursday back to its quarterly pivot at $111.44 before turning higher. There is next strong resistance in the $115.50-$116 area with the daily starc+ band at $116.10.
There is minor support now at $112.45 and the 20-day EMA, which is trying to turn up.
The weekly relative performance (not shown) did form a negative divergence at the recent highs but has now turned up. It needs to move back above its WMA to suggest renewed strength in the small-cap sector.
The daily OBV did make a new high on Friday, as it closed above the January high. The OBV held well above the support from November-December, line f, on the correction.
The daily Russell 2000 A/D line is back above its WMA, but is still well below the prior highs suggesting that the rally in the small-caps is not broad based.
NEXT PAGE: Sector Focus, Commodities, and Tom's Outlook
|pagebreak|Sector Focus
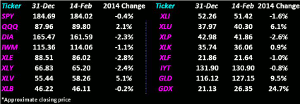
The iShares Dow Jones Transportation (IYT) was one of the ETFs that I regularly follow that has not closed below its quarterly pivot in 2014 (see table). It dropped down to a low of $126.18 on February 5, which was just below the quarterly pivot of $126.16. It then closed that week at $129.56.
IYT still needs a daily close back above the $131.50 level and the monthly pivot to signal a test of the $134-$135 area. Once above the prior high at $135.93, the weekly starc+ band is at $138.73.
Last week’s strong action has erased some of the negative signs for the year with the Select SPDR Health Care (XLV) and the Select SPDR Utilities (XLU) still leading the sector stock ETFs with gains of 5.9% and 5.0%, respectively.
The PowerShares QQQ Trust (QQQ) is now up 2.2% for the year, while the Select SPDR Technology (XLK) is up 1.0%.
The Select SPDR Materials (XLB) is now very close to positive territory but the Select SPDR Industrials (XLI) is still down 1.5%. The heavy construction stocks I recommended last week are part of the industrial sector.
The Select SPDR Energy (XLE) had a better week but is still down 2.7%, which is very close to the 2.5% loss in the Select SPDR Consumer Discretionary (XLY).
Interest Rates: As stocks rallied last week rates moved higher. The yield on the 10-Year T-Note bounced back to 2.76% after reaching a low of 2.57% on February 3. The daily chart shows a broad trading range with key support in the 2.47% area.
Crude Oil
Crude oil was higher again last week, as the April contract closed right at resistance in the $100 area. The volume has been good on the rally over the past few weeks, which has turned the OBV positive. One more strong week is needed to signal a rally to the $105-$107 area.
Precious Metals
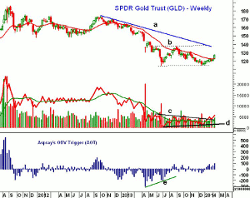
The SPDR Gold Trust (GLD) and Market Vectors Gold Miners (GDX) had a powerful week, as they gapped higher last Monday and never looked back. The next resistance for GLD is in the $130-$131.44 area. There is more important resistance at $137-$139, lines a and b.
The bullish divergence in the OBV, line d, was confirmed last week, as the resistance, at line c, was overcome. The Aspray OBV Trigger formed a positive divergence last summer (line e) but has been firmly above the zero line for the past six weeks.
Never saw a good entry last Monday, as both GLD and GDX were set to gap higher on the opening. In hindsight, should have just bought the opening. There will be a setback in the next few weeks that will give us a new entry point, as I would not chase the market now.
The Week Ahead
Both investors and traders are fortunate to have a long weekend to review their positions and, more importantly, their strategy. After the close, one TV financial commentator said the only thing that would bring the market down was a meteor striking New York. This supports my view that on a short term basis we are due for some consolidation, if not a pullback.
Investors should have some good opportunities to buy in the next several weeks, as there are quite a few stocks, as well as sectors that did not make new highs in late 2013 and are starting to show accumulation at good support.
The strength of the recent rally makes a test of the lows quite unlikely, but one needs to stay with the strongest sectors, like biotech, which broke out last week on the back of strong earnings. Despite the market enthusiasm, one still needs to focus on the risk of any new positions, as it will help keep you from chasing stocks or sectors.
It now looks less likely that my buy levels in either the Euro ETFs or Japanese ETFs will be hit and will look to adjust the buy levels this week.
The dollar cost averaging in an S&P 500 tracking ETF or mutual funds should have been initiated on January 24, as I discussed in A Path to Investing Success in 2014. The third of five equal purchases should be made next week.
Don't forget to read Tom's latest Trading Lesson, The Most Powerful Pivot Level.
Editor’s Note: I hope to see some of you at The Traders Expo next week in New York, February 16-18, 2014. Please stop and say hello if you see me and you can sign up here, it’s free.

