Although the constant noise from the 24/7 news cycle has made managing your portfolio more challenging, MoneyShow's Tom Aspray counsels that you shouldn't let this detract from your overall investment strategy.
It was a rough week in the stock market as the major averages saw the heaviest selling since last September when investors were disappointed at the Fed's decision not too taper. The government shutdown in early October caused many others to sell in a panic just before the market bottomed.
The latest catalyst was the poor economic news out of China, which spurred liquidation in many of the emerging markets, further depressing their currencies. Several notable earnings' misses from several stocks, like International Business Machines (IBM) and Kansas City Southern (KSU), made many nervous about their portfolios as KSU was down 14% on Friday.
It has consistently been my view that any news-related event or economic report (excluding war) should not be a reason to alter your overall investment strategy. There have been countless articles and data points over the past three years that warned of a hard landing for the Chinese economy.
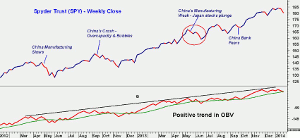
I have highlighted some on the chart, as in early May of 2012, news that Chinese manufacturing was slowing hit a market that had already turned lower. By the end of the month, concerns over the Eurozone had also surfaced. The bearish sentiment continued to rise as many regretted not selling at the start of May.
According to AAII, the individual investor was worried as the bullish % dropped over 20% in just two months. In early June, there were technical signs that the stock market had bottomed out.
The market was rattled again in September of 2012 by disappointing news from China and some columnists were looking for their economy to crash because of overcapacity. The poor action by market leader Apple, Inc. (AAPL) helped to accelerate the decline.
The US market has not been immune to China shocks in 2013 as a plunge in the Japanese market on May 24 was a reaction in part to more weak manufacturing data out of China. But just a month later, the correction in the US market was over as it was no longer overbought (see chart). The weekly on-balance volume (OBV) on the bottom of the chart has continued to make higher highs, line a, since early in 2012.
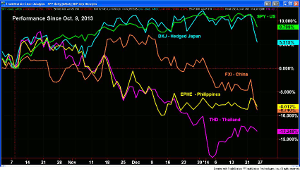
There is no question that it has been a rough few months for the Asian markets as since the October 9 low they have lagged behind the Spyder Trust (SPY), which is now up about 8.8%. Thailand (THD) has done the worst of the group, down over 13%, and the Philippines (EPHE) has also been weak since November.
The recent plunge in China (FXI) puts it down 8% and even the hedged Yen Japan ETF (DXJ) has lost almost 5% in just a week or so.
In last week's column, Souring Sentiment Will Help Stocks, I discussed how the sentiment needed to become more negative in order to create a good buying opportunity. Last week's action is a step in the right direction as despite the market bullishness in December, I thought that the risk was high and that only selective buying was warranted.
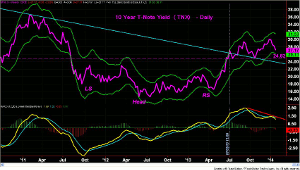
The sharp drop in the stock market has caused a surge into the bond market as the yield on the 10-year T-note has dropped from just over 3% at the end of 2013 to 2.72% this week. The key support is now at 2.48% and a weekly close in yields below this level will suggest a drop down to the 2.2% area.
The MACD-His did form a negative divergence at the late 2013 highs (line a) and does favor lower yields for now. As I mentioned in my recommendations for 2014, I forecasted that yields would be higher in 2014. This was based on the completion of the 18-month reverse head-and-shoulder bottom formation last May.
On a year to year basis, I think that rates are going to be higher as this bottom formation is more significant technically than the recent top. The lower yields will provide some relief for bond holders and may be what the homebuilding stocks need to turn higher again.
NEXT PAGE: What to Watch
|pagebreak|In last Monday's holiday column, I urged investors to take the time to review their portfolios and to take a proactive approach. The current selloff should be followed by a good bounce this week, which may give me a better idea of how long the current correction will last.
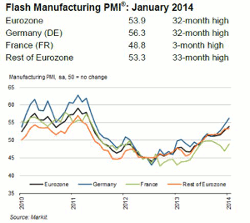
The US economic data last week was mixed as manufacturing slowed a bit according to the Markit Flash PMI but the Existing Home sales bounced back last month and the Leading Indicators were up only slightly after the sharp improvement in November.
The news from the Eurozone continues to show improvement and the current decline should provide some good opportunities in the euro-based or specific country ETFs. For the first time in six years, there were signs of job growth in Spain and the demand for their bonds has been strong.
The PMI data is also encouraging as it hit a 32-month high for the Eurozone and Germany according to Markit. All of the PMI indexes are trending higher, which continues to favor further economic improvement in 2014.
On Monday, we get more data on housing with the New Home Starts followed by the S&P Case-Shiller Housing Price Index on Tuesday. Also on Tuesday we have the Durable Goods and Consumer Confidence.
The FOMC is meeting this week and they will have their announcement on Wednesday afternoon, which will definitely get the bond market's attention. Thursday's jobless claims will be followed by the advance reading on 4th quarter GDP and Pending Home Sales.
On Friday we will get the Personal Income and Outlays , Employment Cost Index, Chicago PMI, and Consumer Sentiment.
What to Watch
Through last Wednesday evening, it was just another choppy week for the stock market as the large-cap Dow Industrials continued to diverge from the Nasdaq as well as the Dow Transports.
There continued to be signs of sector rotation before the entire market collapsed at the end of the week. This has taken the major averages to significant new lows for the year but the major averages, other than the Dow, are holding well above the quarterly pivots (1st Quarter ETF Levels to Watch). There is more important support at the December lows.
The severity of the decline in just two days should cause a significant change in market sentiment as those who were waiting to “buy the dip” are probably having second thoughts. This has also already created short-term oversold conditions as only 424 stocks advanced on the NYSE in Friday’s session with 2720 declining.
The % of S&P 500 stocks above their 50-day MAs had dropped to 59%. It will likely take another week or two before it drops below the 40 level and starts to reach levels that have corresponded to past market lows.
This keeps the market risk at moderately high levels where it has been since before Christmas. I will need to see more significant oversold readings and bottoming signs from the technical indicators before doing any aggressive buying.
It will take more time to see how my recent recommendations will turn out though most were bought close to good support where the risk could be well contained. (see 2 New Portfolio Picks).
In last Monday’s column, I did recommend lightening up on some positions and tightened some stops. I will be reviewing the positions over the weekend to see if further selling is warranted on expected rebound this week.
NEXT PAGE: Stocks
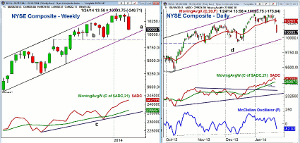
|pagebreak|The weekly chart of the NYSE Composite shows the sharply lower close below the prior four-week lows and just above the quarterly pivot at 10,082. There is further chart support at 9970 (line a) and then in the 9900 area, line b. This was the low from last November, which also corresponds to the weekly starc- band.
The weekly A/D line does not reflect the data from Friday but the A/D line is likely back to early January low (240000) and it is still well above the rising WMA. There is more important support for the A/D line at line c.
The daily chart shows the similar zone of converging support in the 9000-10,000 area, which could be reached with one more day of selling.
The daily NYSE Advance/Decline made new highs last week but will likely close the week below its daily WMA. This should set the stage for a rebound but if it fails at the flattening WMA, it will make a deeper correction more likely
The McClellan oscillator has dropped sharply below the zero line and is now around -82. There is next support in the -150 to -170 area. The extreme oversold levels are still much lower in the -280 to -320 area.
There is first resistance now at $10,200-10,250 with the 20-day EMA at 10,280.
S&P 500
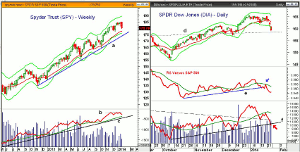
The Spyder Trust (SPY) was down over three points on Friday with the quarterly pivot at $177.97. This is the next likely downside target with the December low at $177.32. This is also the level of the 20-week EMA.
The weekly starc- band is at $175.75 with the weekly uptrend, line a, at $174.20.
The weekly OBV made slight new highs with prices, line b, and is still well above the rising WMA and support at line c.
The daily on-balance volume (OBV) has dropped below its WMA and did fail to confirm the recent highs. It is close to breaking its short-term uptrend (not shown) and there is more important support now at the December lows.
Dow Industrials
The daily chart of the SPDR Dow Industrials (DIA) shows the close below the daily starc- band on Friday. This makes some sideways trading or a bounce likely over the next few days. The close was right on the quarterly pivot at $159.15.
The 20-week EMA is being tested now with the weekly starc- band at $156.87. There is more important support now from early November at $154.87.
The daily relative performance broke its uptrend on January 14 and it retested its WMA last week before plunging.
The daily OBV, as I noted last week, also failed to move above its WMA last week and has now dropped below the trend line support at line f. There is resistance at $162-$162.80.
Nasdaq-100
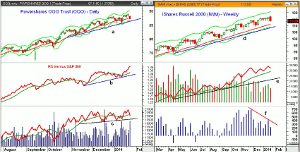
The PowerShares QQQ Trust (QQQ) formed a doji on Wednesday and on Thursday’s close triggered a low close doji sell signal. There is next support at $85.68 to $86.30 (line a) with the quarterly pivot at $84.09. This is just above the December low of $84.05.
The close was below the still rising 20-day EMA with the weekly starc+ band at $83.33. There is resistance now at $88-$89.
The daily relative performance made further new highs as it completed its short-term correction in early January. It continues to be the strongest of the four market-tracking ETFs.
The daily on-balance volume (OBV) dropped below its WMA with Friday’s close and has next important support at line c. The weekly OBV made a new high two weeks ago and did turn down last week. It is well above the clearly rising WMA.
The daily Nasdaq 100 A/D line (not shown) has dropped back below its WMA and also violated the short-term lows. This appears to be the start of a short term downtrend.
Russell 2000
The iShares Russell 2000 Index (IWM) had the widest daily range since early November and is still well above the quarterly pivot at $111.44. The rising 20-week EMA is at $110.81 with the weekly starc- band and support (line d) at $108.82.
The weekly OBV still shows a pattern of higher highs, which is bullish for the intermediate term. It is well above its WMA which is rising.
The Aspray OBV Trigger (AOT) is still well above the zero line but did turn lower last week. It has formed lower highs but this divergence is outweighed by the new highs by the OBV.
The daily Russell 2000 A/D line (not shown) has turned lower but is still above its WMA, which is starting to flatten out. There is resistance now in the $115.62 to $116.43 area.
NEXT PAGE: Sector Focus, Commodities, and Tom's Outlook
|pagebreak|Sector Focus
The iShares Dow Jones Transportation (IYT) had a rough week as it was down over 4% on Friday. It is now down over 1% for the year, though technically, the indicators are holding up well.
There is next support in the $129 area with the quarterly pivot at $126.18. There is resistance now in the $132.50-$133.50 area.
After last week, only the gold ETFs and the Select SPDR Health Care (XLV) are still in positive territory for 2014.
The Spyder Trust (SPY) and the SPDR Dow Industrials (DIA) are the weakest while the PowerShares QQQ Trust (QQQ) is just down 1.4%. The iShares Russell 2000 Index (IWM) is now far behind down 1.6%.
The biggest losers are the Select SPDR Consumer Discretionary (XLY) down 5% along with the Select SPDR Materials (XLB).
The Select SPDR Energy (XLE) and Select SPDR Industrials (XLI) are almost as bad, down 4.7%. The Select SPDR Utilities (XLU) are unchanged with the Select SPDR Technology (XLK) down 1.7%
Crude Oil
The March crude oil contract closed the week over $2 higher and the weekly chart shows a potential bottom formation. A sharply lower close this week would be a worrisome sign.
Precious Metals
The SPDR Gold Trust (GLD) and Market Vectors Gold Miners (GDX) were higher for the week. I reviewed them on Thursday in Buy the Miners Not the Gold and recommended new longs in the miners on a pullback to support. Instead, they moved sharply higher, so I will look for a new entry point once we get a setback or the ranges narrow.
The Week Ahead
Last week’s action certainly has clarified the outlook for the next few weeks as it is unlikely that the market can turn around in a short period of time. The important point to note is that the positive long-term trend has not changed and the current decline will present a good buying opportunity.
The correction could last just a couple of weeks or even as long as six to eight weeks. After a rally, which is expected by mid-week, it will be important to judge the extent of the selling on the next decline. The short-term A/D and volume indicators have a good record of spotting the correction lows and, of course, I will be monitoring them closely
As I pointed out in A Path to Investing Success in 2014, those not in the market should have started their dollar cost average program in an S&P 500 tracking ETF or fund as the S&P 500 was down over 2%. It is important that you do not have to pay commissions. Equal purchases will be made every two weeks until you are fully invested.
As for individual stocks, I think that those sectors that have done the best since the October lows are likely to be the leaders once this decline is over. The relative performance analysis should confirm this once the market starts to bottom out.
Don't forget to read Tom's latest Trading Lesson, 4 Picks from 3 Top Groups.
Editor’s Note: If you’d like to learn more about technical analysis, attend Tom Aspray’s workshop at The Trader’s Expo New York, February 15-17, 2014. You can sign up here, it’s free.

