October has historically been a scary month in the stock market, but not this year, and MoneyShow’s Tom Aspray investigates whether November can top October’s strong performance.
The stock market surprised the majority of analysts again in October as the S&P was up 4.4%, the Nasdaq 100 was up 3.8%, and the Russell 2000 gained 2.5%. The Dow Industrials did a bit better than the small caps, for a change, as it was up 2.7% but the Dow Transports led the pack, up close to 6%.
Last summer, several analysts warned investors about the poor historical record for stock prices in September as in the past 60 years, the S&P was down on average 0.8%. The technical picture in early September had improved as many stocks had already reached good support.
At the end of September, many were again concerned about the potential for an “October crash” and the government shutdown caused some to sell in a panic. The dramatic rally from the October lows reinforces that it is better to invest or trade based on hard data not emotion.
So how do stocks normally do in November? Since 1952, the S&P has averaged a gain of 1.40% as it was up 41 years and down just 20. Going back just 20 years, there is not much difference as the S&P was higher in 14 years and lower in seven with an average gain of 1.34%.
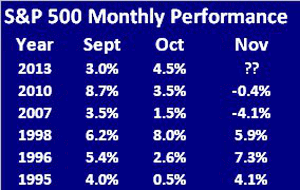
So what does history tell us about November’s performance after there have been nice gains in the preceding two months? The S&P 500 was up 3.0% in September 2013 and 4.5% in October. Since 1992 there have been only five years with similar gains in both September and October.
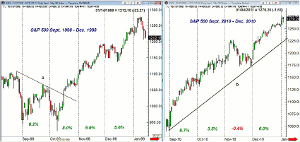
The best performance was in 1996, when the S&P added an additional 7.3% in November while 2007 was the worst, as the S&P 500 dropped 4.1%. I found that the most interesting charts were from 1998 and 2010.
The chart shows that the 6.2% gain in September 1998 was followed by a sharp drop in early October that took the S&P 500 below the September lows on October 8. The downtrend, line a, was overcome five days later and stocks stayed strong into the end of the year as an additional 5.6% was added in December.
The decline in 2013 ended on October 9 when the S&P 500 formed a doji. It took six days of strong action before the S&P 500 was able to make new highs in 2013. On this rally, the weekly NYSE Advance/Decline line broke out to the upside, which is a bullish signal for the overall market.
In 2010, stocks bottomed in early September as the A/D line started to lead prices higher early in the month. The rally lasted until November 5 as the S&P 500 dropped 4.5% in just seven days but held the lows late in the month resulting in a small monthly loss. This was followed by a strong December as the S&P gained 6%.
So what do I think will happen in November 2013? The strong monthly finish has caused some of the TV analysts to start talking of a bubble, which from a contrarian standpoint is bullish. There are some signs that the market is losing momentum on a short-term basis but it would take a very ugly weekly close to suggest a sharp decline in November.
If the market does correct 2-3% and then the S&P 500 challenges the 1800 level, it could lead to some pre-Thanksgiving profit-taking and possibly a fractional monthly change. I still think it is best to focus on stocks, not the market, as last December’s signal from the market internals for a double-digit year is still intact.
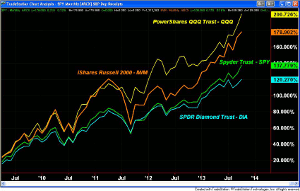
Of course, being in stocks that are in the strongest sectors will be the key, and I reviewed some my favorite sectors from a monthly and weekly perspective in the most recent Trading Lesson. Since the stock market’s 2009 lows, there has been a wide disparity in how the index-tracking ETFs have performed.
The Powershares QQQ Trust (QQQ) is clearly the leader, up over 200%, which is over 20% better than the iShares Russell 2000 (IWM), which is up 178%. The small caps have done over 40% better than the large cap Spyder Trust (SPY) but this performance does not include dividends, which would narrow the gap considerably. The SPDR Dow Jones Industrials (DIA) has continued to lag as its price is up just 120% during the bull market.
From a global standpoint, the economies and stock markets of the developed world continue to improve with the German Dax Index making a new all-time high in October. I continue to expect further improvement in the US and Eurozone economies in the coming months. This should also help turn things around in the emerging markets.
NEXT PAGE: What to Watch
|pagebreak|
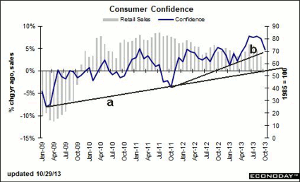
The US economic data last week was generally positive as the S&P Case-Shiller Housing Price Index continued to improve last Tuesday even though consumer confidence took a hit in reaction to the government shutdown.
Both the short- and long-term trends in consumer confidence (lines a and b) are still intact, and it shows a pattern of higher highs. The weakness in the retail sales was not too surprising but it is the next two months that will be important.
Good news from the manufacturing sector on Friday as the ISM Manufacturing Index came in at 56.2, which was the highest reading since April 2011. Though the new order component was pretty much unchanged, the exports were up sharply.
On Monday, we will get the latest data on factory orders, followed on Tuesday by the ISM non-Manufacturing Index. The preliminary 3rd quarter GDP report is scheduled on Thursday along with the jobless claims. The delayed November jobs report comes out on Friday and should be closely analyzed, though any tapering before year-end seems unlikely.
What to Watch
The stock market rally from the October 10 lows did resolve some of the signs of technical weakness that I have been discussing over the past two months. This does allow for further gains going into the end of the year, even though it has been a great year already.
There is still quite a bit of money on the sidelines as many are still scared to death about the stock market. This could be as much as $10 trillion dollars, but it may take some time and even better economic news before much of this comes into the stock market.
The market-leading iShares Russell 2000 (IWM) was hit late last week and is already down close to 3% from its highs. This takes it back to a level of support going back to September. This makes it possible that the market’s corrections may be already close to over. The S&P 500 is holding up better with next strong support in the 1726 area, which is the monthly pivot for November.
After the gains, so far in 2013, a deeper correction is also possible but it would take a close below the early October lows to weaken the intermediate-term outlook. Still, this is not a time to be complacent as one should always have stops in place and take partial profits, especially when they come over a short period of time.
The number of S&P 500 stocks above their 50-day MAs, which had bottomed out in early October has rebounded back to the 80% level. It does currently show a pattern of higher highs and higher lows with support at 67%, which is the mean.
The bullish individual investors, according to AAII, rose to 49.2% last week, which was the highest reading since June. The bullish % declined to 45% this week. The bearish % got as low as 17.6% but is now back to 21.5%. The financial newsletter writers also got more bullish closing the month at 52.6% bullish and just 16.5% bearish. The remainder is in the correction camp.
NEXT PAGE: Stocks
|pagebreak|
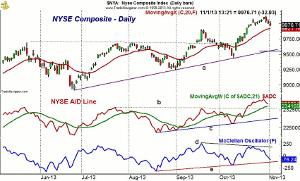
The daily chart of the NYSE Composite shows that it did close above 10,000 last week before some profit-taking. It is already close to the 20-day EMA at 9921, which also corresponds to the September highs.
There is additional support now at 9650-9700. The daily uptrend and the quarterly pivot are now in the 9560 area with the October low at 9441.
The daily NYSE Advance/Decline moved above the July and September highs, line b, on October 17. The May highs were also overcome, which confirms the price action. The weekly NYSE A/D line (see chart) has also completed its trading range, which is consistent with the start of a market rally and not a top. The daily A/D line has good support now at line c.
The McClellan oscillator did not make a new high with prices, line d, and has dropped back below the zero line. There is support in the -200 area though a drop back to -300 would not alter the major trend.
S&P 500
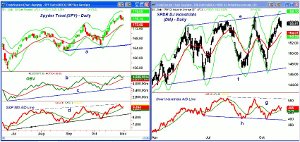
The Spyder Trust (SPY) made a new high at $177.51 on October 30 but gave up some of its gains by the close. So far, the pullback has been mild with next support at $174 with the 20-day EMA at $173.67. This also corresponds to the September high.
For November, the monthly pivot is at $172.61 with stronger support at the $170 area. The quarterly pivot is at $167.72 and a weekly close below this level would be negative.
The daily on-balance volume (OBV) did move above the September highs, line b, on the recent rally but not by much. It is still holding above its rising WMA.
The daily S&P 500 A/D line also confirmed the price action by making new highs (line d) and is close to testing its rising WMA. It is well above more important support.
A close above the $177 level would be a short-term positive sign with the daily starc+ band at $179.05 and the weekly at $179.12.
Dow Industrials
The SPDR Dow Industrials (DIA) did do a bit better in October but has been a lagging sector for some time as the relative performance has been in a clear downtrend. The quarterly R1 resistance at $156.66 was tested last week.
There is first support now at $153.99 and the rising 20-day EMA with the quarterly pivot at $152.02. The chart support connecting the April-June lows, line f, is at $147.15 and is now more important.
The Dow Industrials A/D line is still locked in a trading range, lines g and h, but is trying to run up from its WMA. This is an encouraging sign as maybe the blue-chip stocks are finally going to join the party.
Nasdaq-100
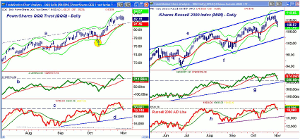
The PowerShares QQQ Trust (QQQ) made new highs last week at $83.49 and has since stayed in a narrow range. The daily starc+ band is at $84.54 with the quarterly R2 at $85.29.
There is further support now at $81.44 (line a) and the still rising 20-day EMA. The September high at $79.68 and the $80 level are more important support.
The OBV did make further new highs last week, which is a positive sign. It is now back to initial support, line b, with further at its WMA.
The Nasdaq 100 A/D line, as suggested last time, was able to breakout above the key resistance at line c and confirms the price action. The A/D line has dropped below its WMA, which could be a sign that the correction is close to over.
Russell 2000
The iShares Russell 2000 Index (IWM) made a high last week at $111.62, which just exceeded the quarterly R1 at $111.37.
The close last week was below the 20-day EMA as the September highs and the daily starc- band are now being tested. The rising 20-week EMA is now at $104.37 and has supported prices throughout the year.
The daily OBV did just make slight new highs last week and is now back below its WMA as it is exhibiting more weakness than the OBV on the QQQ. It is still well above the longer-term uptrend, line g.
The Russell 2000 A/D line does look stronger as it moved well above the previous two highs before dropping back below its WMA. There is next strong support for the A/D line at line h and then the late August lows.
The daily relative performance analysis (not shown) did not confirm the recent highs and is now in a short-term downtrend. The weekly RS line has also dropped below its WMA but did confirm the recent highs.
NEXT PAGE: Sector Focus, Commodities, and Tom's Outlook
|pagebreak|
Sector Focus
The iShares Dow Jones Transportation (IYT) put in a strong performance in October as it was up close to 6% for the month and hit a high of $126.96 last week. The weekly starc+ band is now at $128.94.
The daily and weekly technical indicators are positive and confirm the price action. IYT was strong last Friday and continues to be a market-leading sector, basis the multiple time frame relative performance analysis.
In last week’s Trading Lesson Profiting From Multiple Time Frame Sector Analysis, I reviewed some of the longer-term charts of the Sector Select ETFS. I also looked at the performance of these ETFs over the past three quarters and the year to date.
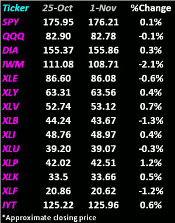
The review of last week’s performance shows a wide range, with the iShares Russell 2000 (IWM) down over 2% while the Select SPDR Consumer Staples (XLP) was up 1% for the week.
The Sector Select SPDR Industrials (XLI), Select SPDR Consumer Discretionary (XLY), Select SPDR Health Care (XLV), and Select SPDR Technology (XLK) all closed in positive territory for the week.
Last week, I reviewed the outlook for the energy sector and made new recommendations as several of my buy levels in the energy ETFs had been hit.
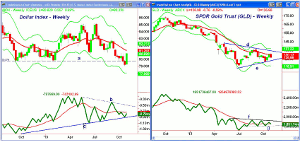
Dollar Index: The dollar index had a very strong weekly close after breaking support at line a, the previous week. The 20-week EMA is at $81.27. The OBV has turned up from the longer-term uptrend, line c. The OBV needs to overcome its WMA and the downtrend, line b, to turn positive.
Crude Oil
Crude oil was hit hard last week as it closed down well over $3 per barrel. Prices are now in a solid area of support but there are no signs yet of a bottom.
Precious Metals
The Spyder Gold Trust (GLD) lost almost $4 per share last week as it tried to close above its flat EMA before turning lower. The technical outlook has turned more negative as the weekly chart suggests that a continuation pattern, lines d and e, is forming.
A break of the support at line e will signal a move to new lows. The OBV also shows a negative formation as it has formed lower highs, line f. The OBV may break support at line g before prices violate support.
The Week Ahead
Though it has been a great year for stocks, I do think further gains are likely before the end of 2013. The sharp rise in the major averages is keeping many on the sidelines but there are quite a few stocks that appear to be bottoming after testing good support.
Therefore, it is clearly a stock picker’s market, and I would look for stocks to buy, not averages. Some of the sector ETFs do look attractive, and I will continue to make recommendations where the risk can be well controlled.
I am still looking to get back into the homebuilders, but it will take some more weakness to get them down to attractive levels. This is also true of the department store stocks, which I covered last week. The emerging markets should be a good play as I have several of the country ETFs on my radar.
For those new to stocks, I hope you implemented the dollar-cost-averaging strategy that I discussed in early August’s column It's Never Too Late to Build a Portfolio.
I would continue implementing the dollar-cost-averaging strategy in the Vanguard FTSE Emerging Markets ETF (VWO), and I focused on the emerging markets last week.
Be sure to have your plan in place, which will help you avoid reacting emotionally to the market action
Don't forget to read Tom's latest Trading Lesson, Profiting From Multiple Time Frame Sector Analysis.

