Investors' emotions weren't the only things to go on a rollercoaster ride after the Federal Reserve's decision not to taper, MoneyShow’s Tom Aspray explains what else happened, and what to expect before the ride's over.
The majority of analysts and economists were quite shocked by the FOMC announcement last Wednesday to leave their bond buying program intact.. There were a few unusually angry comments from investment pros as they apparently tried to save face for telling their client that the taper was a sure thing.
There was also a consensus amongst investors that the FOMC announcement would have little impact on the markets and that was also wrong, but hopefully, they did not sell ahead of the announcement.
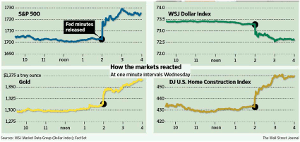
It was definitely a wild ride for the markets after the FOMC announcement, as the extent of the swings in many of the key markets surprised even the most seasoned pros. The one minute charts of the S&P 500, gold, the US dollar and the DJ US Home Construction Index from the WSJ illustrates this point.
The S&P 500 was trading just below 1703, and then proceeded to move above 1729 in the next sixty minutes. This was a change of over 1.5%. Gold was trading around $1317 per ounce just before 2:00 PM Eastern and then shot up to $1358 before the day was over.
The dollar index plunged on the news, while the DJ US Home Construction Index was up about 6.5%, as traders jumped in, to buy the homebuilding stocks or cover their short positions. Interest rates dropped sharply and, as I noted on Thursday, it is my view that there were “Pivotal Turning Points in 4 Key Markets”.
Some seasoned investors, like Jim McDonald, the chief investment strategist for Northern Trust, thinks stocks are the best place to be. They have $803 billion under management and he commented that "The relative return prospects for stocks look measurably better than bonds."
Of course, the stock market still has plenty of challenges to overcome, as the casting for Dumb and Dumber continues, with the budget and debt ceiling battle in Washington DC. Investors are already nervous about the upcoming earnings season, which starts on October 8 with Alcoa Inc. (AA).
It is likely that the stock market will take some time to digest the recent gains, as choppy trading is common in both September and October. Since the outlook for the earnings seasons is quite negative, they may be better than expected. From a technical standpoint (see below), there are still some hurdles for the market to overcome, but I expect even higher prices by year-end.
There are also plenty of global challenges for investors, as, by Monday’s opening, we may know the winner of the September 22 German elections. While Angela Merkel may win, she may have a tough time putting together a winning coalition.
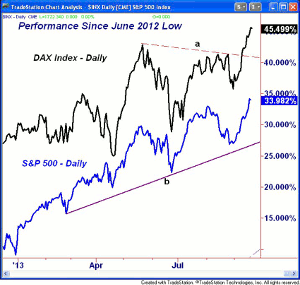
This uncertainty has not held back the German stock market as the Dax Index continues to lead the S&P 500. Since the June 2012 lows, it is up well over 45%, which is considerably better than the 34% rise in the S&P 500.
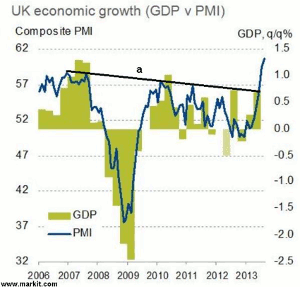
The economic data in Europe continues to improve, as there are more clear signs that the recession is over. However, like in the US, the recovery is likely to be feeble initially. Things are also looking up in the United Kingdom, as their Purchasing Managers Index (PMI) surged in the latest reporting period, breaking through the resistance, line a, that goes back to 2006. This has helped to strengthen the pound, and a move above 1.6800 would be an upside breakout.
The lack of fed action clearly illustrates the sluggish nature of the US economy, but one needs to separate the short- and long-term economic outlook. In both 2010 and 2011, the economy hit some soft patches that lasted long enough for some to conclude we were in another recession. The latest fed projection is for GDP growth to be 3% in 2014.
NEXT PAGE: What to Watch
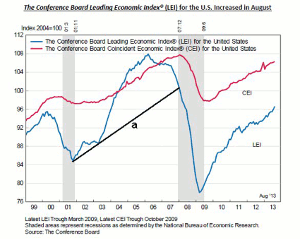
|pagebreak|One of the more important indicators that I follow is the Conference Board’s Leading Economic Indicators (LEI). The chart shows that the LEI peaked in early 2006, and then declined steadily until the uptrend, line a, was broken in early 2008.
Last Thursday’s release of the August LEI was a surprising 0.7%, which beat expectations and surprised many economists. The chart shows the strong upturn with this new data, and clearly the LEI shows no signs of losing upside momentum.
On Monday, we get a new reading on US manufacturing with the Markit Flash Manufacturing Index, as well as the Chicago Fed National Activity Index. The market will also be closely watching Tuesday’s S&P Case-Shiller Housing Price Index and Consumer Confidence.
Wednesday is another big day for the economy with Durable Goods and New Home Sales, followed on Thursday by the final reading for second quarter GDP. The week ends with Personal Income and Outlays, as well as the final reading for September on Consumer Confidence. A big improvement from the very weak mid-month reading of 76.8 would be a plus, especially for the retail stocks.
What to Watch
This will have been an interesting weekend for most investors, as they determine the impact of the Fed’s surprise move on their portfolios. The correction from the August highs did not last as long as I expected, but the positive action in early September favored buying stocks.
It is always helpful to objectively analyze the positive and negative technical readings for the stock market. It allows one to have better, well-defined guidelines so that you can identify trend changes soon after they occur.
On the plus side for the stock market, the weekly and daily on-balance volume (OBV) are rising and above their WMs. Most of the daily OBVs have confirmed the new highs, but not all of the weekly indicators have made new highs yet.
The daily A/D lines completed their bottom formations in the first week of September and are still in clear up trends. This is positive, but only the S&P 500 daily A/D line has made new highs and the others are still below the August highs. This is negative, as is the fact that the number of NYSE stocks making new 52-week highs has not surpassed the highest reading from last May.
The market is also not nearly as oversold as it was a few weeks ago, as 74% of the S&P 500 stocks are above their 50-day MAs, as compared to 30% at the August lows. These values often top-out ahead of prices during strong rallies and typically forms divergences at market highs.
The sentiment is also not as negative as I would like it to be, as 45.1% of the individual investors, according to AAII, are bullish with just 29.7% bearish. The financial newsletter writers got more bullish last week, as the bullish% rose to 42.3% from 37.1%, and just 21.6% are bearish.
To sum it all up, there are many stocks that have just come out of bases, or completed normal corrective patterns, unlike the major averages. Therefore, they are likely to be well-supported on a pullback, even though the averages are at all-time highs. It would take several days of heavy selling to weaken the short-term outlook, and even more time for them to turn negative.
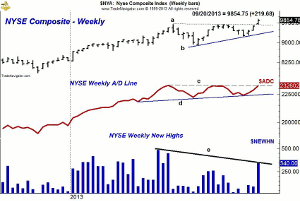
The weekly chart of the NYSE Composite shows that it completed a flag formation last week by closing above the resistance, at line a. The weekly starc+ band is at 9963 with the upside targets from the formation in the 9900 to 10,300 area. The NYSE Composite made its all-time high at 10,387 in 2007.
The weekly NYSE Advance/Decline line also appears to have broken out of a trading range, lines c and d, but further strength is needed to confirm the new highs. The weekly A/D line on the Nasdaq Composite has clearly made new highs.
The daily McClellan oscillator (not shown) hit a high of 247 last Tuesday, before turning lower and is back to the +100 level. The daily A/D line is still below, both, the July, and May highs, but is well-above its rising WMA.
There is initial support at 9750 with the 20-day EMA and daily starc- band in the 9620-9600 area. The monthly pivot is at 9401 with the S1 support at 9329. The August low at 9246 is a more important support level.
NEXT PAGE: Stocks
|pagebreak|S&P 500
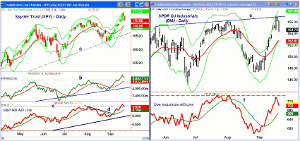
The Spyder Trust (SPY) made further, new all-time highs Thursday, at $171.60, as the daily starc+ band was tested. There is next support now at $170-$171.20, with the 20-day EMA at $168.92. The weekly starc+ band is now at $174.86.
The daily on-balance volume (OBV) has moved well-above both, the August, and May highs, last week. It is well-above its rising WMA. The weekly OBV (not shown) has also confirmed the new highs.
The daily S&P 500 A/D line moved through its downtrend, line d, in early September, and has now moved above the August highs, line c. The WMA is rising nicely, which is a positive sign.
There is daily support now at $170-$171, and the August highs, with the rising 20-day EMA is now at $168.90. The short-term 50% Fibonacci retracement support, from the recent lows, is at $168.40, with the monthly pivot at $165.89. The weekly starc+ band is at $174.65.
Dow Industrials
The SPDR Dow Industrials (DIA) also made new all-time highs last week, as it reached the trend line resistance, at line e. There is minor support now at $155.50, with the rising 20-day EMA and the starc- band at $152.85.
The Dow Industrials A/D line has turned lower and has failed, so far, to move through the prior highs, at line f. It is still well-above its rising WMA, despite Friday’s action.
Both the weekly and daily OBV (not shown) are above their rising WMAs and therefore the multiple time frame OBV analysis is positive. Neither has confirmed the new price highs.
There is initial resistance now at $156-$157 with the daily starc+ band at $157.90.
Nasdaq-100
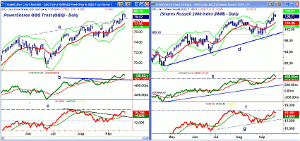
The PowerShares QQQ Trust (QQQ) reached the 79.68 level last Thursday, but then turned lower on Friday. It is still well-above the breakout level, at line a. The rising 20-day EMA is at $77.65, with the starc- band a bit lower. The monthly pivot stands at $75.90.
The daily OBV has moved well-above the August highs, line b, and has confirmed the price action. Its WMA is rising strongly. The weekly OBV (not shown), has also made new highs for the year.
The daily Nasdaq-100 A/D line (shows a clear pattern of higher highs and higher lows, but has not yet surpassed the August highs, at line c. It tested good support last month (dashed line).
Russell 2000
The iShares Russell 2000 Index (IWM) held up well on Friday and closed the week near its highs. The weekly starc+ band is now at $109.20, as IWM has had three solid weeks to the upside.
The daily OBV has risen well-above the resistance, at line e, and has confirmed the price action. Its WMA is rising nicely and the weekly OBV has also confirmed the new highs.
The Russell 2000 A/D line overcame its short term bearish divergence resistance in early September, which was a positive sign. It is in a short-term uptrend, but is still below the August highs. The A/D line has good support, at line g.
The relative performance (not shown) still indicates that IWM is a market leading sector. There is first support now at $105.60 to $106.40 with the rising 20-day EMA now at $104.47. The monthly pivot is at $102.08 and major support is in the $100 area.
NEXT PAGE: Sector Focus, Commodities, and Tom's Outlook
|pagebreak|Sector Focus
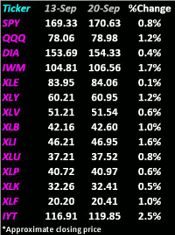
The iShares Dow Jones Transportation (IYT) was the stellar performer last week, as it gained close to 2.5% for the week and closed well-above the August high of $119.45. This is a very positive sign for the economy.
The 127.2% upside target is at $121.62 with the weekly starc+ band at $122.56. The weekly and daily relative performance signal that IYT is a market leading sector. The weekly OBV has confirmed the price action.
All of the 14 ETFs in the weekly performance table closed the week with gains last week, as the Sector Select SPDR Energy (XLE) was the weakest, up around 0.1%.The more defensive Sector Sector SPDR Utilities (XLU) and Sector Select SPDR Consumer Staples (XLP) were up less than 1%.
In addition to IYT, the iShares Russell 2000 (IWM) and Select Sector SPDR Industrials (XLI) did the best, gaining around 1.6%. I have continued to add stocks in health care, material, and the energy sectors, and will be looking and industrial stocks this week. Also, there are a couple of big drug stocks which are looking good.
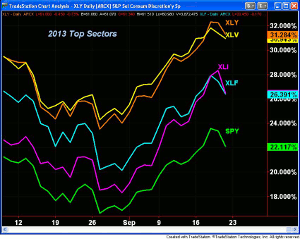
Looking at the performance so far in 2013, the Sector Select SPDR Consumer Discretionary (XLY) has done the best, up over 31% for the year. This includes the retail stocks, which were featured in this week’s trading lesson.
Not far behind is the Sector Select SPDR Health Care (XLV), up over 30%. The Sector Select SPDR Financials (XLF) and Sector Select SPDR Industrials (XLI) have outperformed the Spyder Trust (SPY) by about 4% so far this year.
Interest Rates: The sharp reversal in rates last week completed what is likely a near-term top in yields. I would expect rates to move sideways to lower, over the next month or two. As I mentioned last week, this will be a good time to shorten the maturity of your bond portfolio.
Crude Oil
Crude oil was hit hard late in the week, as it lost over $2.50 per barrel. The weekly OBV did confirm the recent highs, with next important support for the November contract at $101.40. A weekly close back above the $110 level is needed to reassert the uptrend.
Precious Metals
It was a wild week for the precious metals, as there were multiple wide swings with the sellers taking over late Friday.
The Spyder Gold Trust (GLD) closed the week a bit higher. The gold miners, specifically the Market Vectors Gold Miners (GDX), gave up much of its gains by the close on Friday. It needed a strong close for the weekly studies to turn positive. Therefore, this makes the close this week more important.
The Week Ahead
The market bears took over on Friday, as the major averages closed sharply lower with solidly negative A/D ratios. All ten major sectors were down on the day. Clearly, the afternoon vote in the House raised the possibility of a government shutdown, with the debt ceiling also looming. The selling increased in the last few hours of trading, with the averages closing near the day’s lows.
The early release of Blackberry LTD (BBRY) earnings did not help the market tone, as it was down 17%. The selling was exacerbated by the rebalancing in the S&P 500, and the changes in the Dow Industrials, as the volume increased into the close.
The decline on Friday has not changed the positive technical outlook, but it will be important that the market can rebound by the middle of next week, possibly a turnaround Tuesday?
The emerging markets gave up a fair amount of their gains on Friday, but the burst of upside momentum over the past two weeks still suggests they are bottoming. I still favor a dollar cost averaging approach to Vanguard FTSE Emerging Markets ETF (VWO), as discussed in a previous Week Ahead column.
I updated the Charts in Play portfolio last week as I continue to raise my stops as the market moves higher. This would be a good weekend to review the holdings in your portfolio and adjust your stops in light of the new highs last week.
Don't forget to read Tom's latest Trading Lesson, Shop Here for Winners This Fall.

