The stock market’s strong performance last month has MoneyShow’s Tom Aspray examining the technical evidence to see whether it can stay strong as we head deeper into the summer doldrums.
July was a great month for stocks with the Dow Industrials up 4%, the S&P 500 gained 4.9%, and the Nasdaq Composite was up 6.6%. The small-cap Russell 2000 was the leader, gaining 6.9%.
In mid-July, flows into stock funds hit a six-month high at $19.7 billion but there still seems to be some debate as to whether the long-awaited rotation from bonds to stocks is underway. The data is mixed as the record flows into stock funds were accompanied by $4 billion flowing into high-yield junk bond funds.
The public participation in stocks is still at historically low levels, and many are wondering after July’s stellar performance, if August will be as good.
The technical evidence last December suggested the market could see double-digit gains in 2013. With the stock market’s sharp gains, so far this year, the odds for a double-digit year have improved even though we still have five months left in the year.
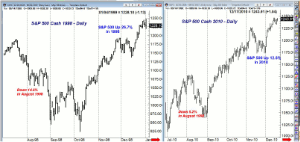
Since 1993, there have been ten years when the S&P 500 had double-digit gains. In only four years did the gains exceed 20%, with the best return being a 34.1% gain in 1995. In examining these strong years, I then started to look at how the S&P 500 did in August in each of those years.
Of these years, the S&P had its worst August in 1998 as it was down 14.6%. The chart shows that in August, the S&P 500 traded in a range for most of the month before plunging the last three days. Still the S&P 500 was up 26.7% for the year.
In 2010, the S&P 500 was up 12.8% for the year but it had the third-worst August since 1993. That year, stocks traded higher for the first seven days of August before prices plunged as the S&P 500 finished 5.2% lower. As the chart indicates, the August decline held well above the July 2010 lows.
Since 1950, August has generally been a flat month for stocks as they were up 36 years and down 27 years. In fact, 1998 was the only year that saw a double-digit loss. I do not expect August to match July’s performance and a flat month for the averages would not be too bad; a 3-5% decline is more likely.
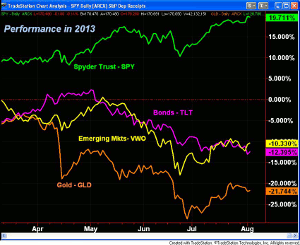
Clearly stocks have been the place to be in 2013 with the Spyder Trust (SPY) up 19.6% and the German Dax Index (not shown) up close to 8%. The weakest performer is still gold as the SPDR Gold trust (GLD) is still down 21.7% despite its recent rally.
The cut in the dividend of Barrick Gold (ABX) will put more pressure on the beaten-down gold miners. The rebound in gold still looks to me like a bull trap as the OBV has already broken down and is likely leading prices lower. A close in GLD below $124 should be enough to signal another wave of selling.
Bonds, as represented by the iShares Barclays 20+ Year Treasury Bond (TLT) are down 12.3%, so far in 2013, while the Vanguard FTSE Emerging Markets ETF (VWO) did only slightly better losing 10.4%.
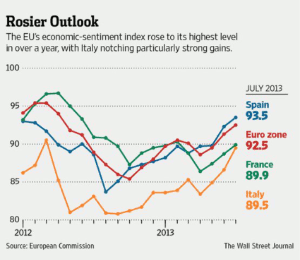
Last week, I noted the improved performance of some of the stock markets in the Eurozone, with France and Germany leading the way. Now, even Spain has moved into positive territory for the year.
This positive action is now being confirmed by data on consumer confidence out of the region. As the graph above indicates Spain’s economic-sentiment index has risen to 93.5, which is the highest level since early 2012. It is even better than the Euro region as a whole where the index is at 92.5.
France and Italy have also risen sharply, and in a separate report, the consumer sentiment in Germany rose to a six-year high. Between now and the German election in September, there is likely to be more news out of the Eurozone but there has been definite improvement in the economic trend.
NEXT PAGE: What to Watch
|pagebreak|
Despite the weaker-than-expected monthly jobs report, the overall US economic data last week was consistent with the gradually improving trend. The S&P Case-Shiller Housing price Index revealed a 1% gain, and the GDP came in at 1.7%, much better that the 1% gain most were expecting.
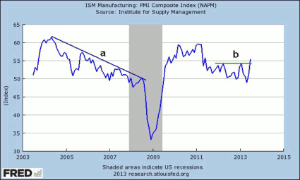
The jobless claims declined last Thursday, and there was even better news from the manufacturing sector. The PMI Manufacturing Index rose to 53.7, its best level since 2011, overcoming the resistance at line b.
The deterioration in the ISM in 2006-2007 (line a) and then the drop below the 50 level before stocks peaked was a good warning sign. Using technical analysis of fundamental data, as I discussed in a recent trading lesson, can be a very useful tool.
The economic calendar this week is fairly light with the ISM Non-Manufacturing Index on Monday, followed by International Trade on Tuesday. Jobless claims are out, as usual on Thursday, with Wholesale Trade data on Friday.
What to Watch
The S&P 500’s close above 1700, Thursday, exceeded all but the most bullish forecasts from the start of the year. The pattern was similar last week as any weakness seemed to be well absorbed by the market. The warnings of a market top reached a fever pitch early in the week and the shorts really got hammered on Thursday’s sharply higher opening. I expected July to be a better month for stocks but it exceeded my expectations.
The benign reaction to the FOMC announcement Wednesday afternoon likely made those on the short side complacent. Correctly playing the short side, just like the long side, is a matter of risk. There are quite a few market professionals that have been trying to short this market since early in the year. Some are still short as they did not have a risk controlled exit strategy. When a market is making new all-time highs, where do you place a stop on a short position?
The sideways-to-lower pattern in the S&P 500 has relieved the overbought readings from many of the technical studies that existed towards the end of July. A majority of the indicators are confirming the new market highs, but there are still some warning signs. Also, the closeness to the starc+bands still makes the market averages a high-risk buy at current levels.
Unlike those who want to sell this market, the stop under the late July lows could be used by aggressive buyers of the market averages. I think a better strategy is to concentrate on individual stocks, especially those which have already reported their earnings.
Still, it is sometimes not easy to get long when you focus on risk. In a mid-July column, I recommended three oil stocks. Both buying levels for Valero Energy Corp. (VLO) were hit while the buy level for Phillips 66 (PSX) at $56.64 was missed by eight cents before it rallied to the $61 area. The third recommendation in EPL Oil & Gas Inc. (EPL) came within one cent of my initial buy level before it rallied sharply.
This is still definitely not a market to chase as I remain confident that there will be better risk buying opportunities in the months ahead. Last December, many were worried about the fiscal cliff and decided to sell when the technical indicators favored buying.
The individual investors have become more cautious as the latest AAII survey reported only 35.6% bullish, down from 45.2% the prior week. The number of bears have also crept up now at 25%, whereas they were below 20 just four weeks ago. Not much change from the financial newsletter writers as they dropped to 48.4% from a prior reading of 51.5%. Still too few bears at 19.6%.
NEXT PAGE: Stocks
|pagebreak|
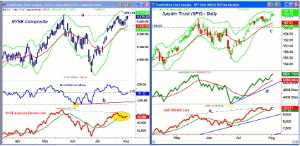
The daily chart of the NYSE Composite shows that despite the further new highs in the Dow and S&P, it is still below the May high at 9695.46, line a. The daily starc+ band is at 9741, which is less than 1% above current levels.
There is first good support now in the 9530 area along with the 20-day EMA. The daily starc- band is at 9479 with the monthly pivot support at 9438.The quarterly pivot is at 9251.
The McClellan oscillator dropped to a low of -45 last Wednesday before it rallied back close to the zero line Thursday. The A/D ratios were neutral Friday, so it has flattened out.
The daily NYSE Advance/Decline line continues to act weaker than prices, and so far, it has failed to reach, much less exceed, the May highs. It now has flattened out at its WMA (highlighted in yellow), which is not a positive sign.
S&P 500
The Spyder Trust (SPY) did make convincing new highs on Thursday as it gapped sharply higher on the opening. The daily starc+ band is at $171.72, which is not far above Friday’s close. The weekly starc+ band is at $175.20.
The on-balance volume (OBV) still shows a clear uptrend, with its WMA rising, and it has just moved slightly above the May highs. There is more important support for the OBV at the uptrend, line d.
The daily S&P 500 A/D made another new high this week and shows a pattern of higher highs, line e. The WMA has started to flatten out but is still rising slightly.
There is minor support now in the $169.40-$170 area and then at $167.53, which was the July 26 low. The monthly pivot for August is at $166.26, which is just above the chart support at $166.03, line c.
Dow Industrials
The SPDR Diamond Trust (DIA) (no chart) made a new high last Thursday at $156.16 but did form a doji. There is next support at $154.40 along with the 20-day EMA. There is more important support at the late July low of $153.67. A close below this level would mean that everyone who bought the Dow in the past three weeks is in the red.
The daily Dow Industrials A/D line came very close to its prior high last week and is still clearly positive. On the other hand, the daily OBV has dropped further below its WMA, which is flattening out. The weekly OBV (not shown) is clearly positive, so there are mixed signals from the multiple time frame OBV analysis.
Nasdaq-100
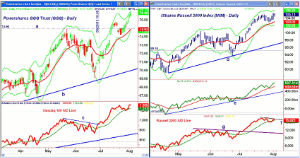
The PowerShares QQQ Trust (QQQ) accelerated to the upside last week as it gained almost 2% and led the other market averages. It is now very close to the daily starc+ band at $77.11 with the weekly at $78.38.
The Nasdaq-100 A/D line turned lower Friday but did make new highs with prices last week. The break through resistance, line c, on June 26 was a very bullish signal. There is key support now for the A/D line at the late July lows.
There is first support at $75.40, which was the quarterly R1 resistance, and now is support. The 20-week EMA is at $74.91 with the late July low at $74.20. The projected monthly pivot support is at $72.68 with the quarterly pivot is at $71.03.
Russell 2000
The iShares Russell 2000 Index (IWM) closed the week at a new all-time high and above the quarterly R1 resistance. The daily starc+ band is now at $106.21 with the quarterly R2 resistance at $106.65.
The daily OBV made a convincing new high last week as it is now well above the July highs. There is initial OBV support at its WMA and then at the uptrend, line e.
The Russell 2000 A/D line did not make a new high last week and has formed a slightly negative divergence, line f. It is barely above its WMA and it will need to be watched closely this week
The rising 20-day EMA is at $103.05 with the daily starc band at $102.10, which is very close to the monthly pivot at $102.03. There is further support in the $100.38 to $101 area.
NEXT PAGE: Sector Focus, Commodities, and Tom's Outlook
|pagebreak|
Sector Focus
The iShares Dow Jones Transportation (IYT) surged to a new all-time high last week as it gained 2.7%. The close was well above the July highs and was a clear breakout above the resistance from the May and June highs. The weekly starc+ band is now at $122.92.
The weekly relative performance, which dropped last week has reversed back to the upside and moved above its prior peak. The OBV has also made new highs.
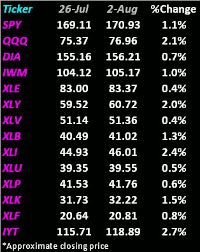
All of the 14 ETFs I normally track for the Week Ahead column were all up last week. In addition to the Transports, the other winners were Select Sector SPDR Industrials (XLI), up 2.4%, and the Select Sector SPDR Consumer Discretionary (XLY), up 2%.
One of my favorite hot sectors, the Select Sector SPDR Health Care (XLV) was just up 0.4% and formed a doji on Thursday’s high. The 127.2% Fibonacci target from the May-June correction was exceeded but technically it still looks fine.
The Select Sector SPDR Technology (XLK) and PowerShares QQQ Trust (QQQ) had another good week and the daily relative performance analysis is on the verge of turning positive
The Select Sector SPDR Energy (XLE) was hit last week as the big oil companies reported weaker-than-expected earnings. This is still a sector I am watching as the summer draws to a close.
Interest Rates
It was a very choppy week in the bond market just like it was in stocks. The yield on the 10-year T-note peaked at 2.723% but then closed Friday at 2.602%. Still, I think the 10-year needs to drop below 2.460% to signal lower yields.
Crude Oil
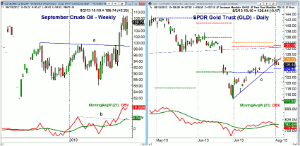
Crude oil closed the week higher, up $2.25 per barrel. The weekly chart shows the major breakout through resistance, line a, in July which has turned the trend higher. The weekly OBV looks very strong as it broke through its resistance, line b, one week ahead of prices.
Now that the resistance at $107.50 has been overcome, the next target is the $110.55 level that I pointed out in the yearly analysis.
Precious Metals
The Spyder Gold Trust (GLD) dropped over $2 last week and the daily chart shows that the uptrend,
line c, has been broken. The monthly pivot is at $124.95 and a drop below $124 should signal heavier selling.
The OBV has dropped below its WMA consistent with a rally failure—this week could be interesting.
The Week Ahead
The full calendar of economic data did create a lot of volatility last week as I had expected but once again the stock market bulls ruled. A round of last-hour buying on Friday erased the early losses and pushed the market averages into positive territory on the close. We should see some more bullish euphoria this week but it is still a dangerous time to buy a market average.
There are quite a few stocks and sectors that have not participated in the rally over the past six weeks, and those are the ones I am concentrating on in this market. The monthly analysis can be quite valuable at a time like this as I pointed out in Top 10 Overbought Dow Stocks. If you can buy a stock that is close to three-month support, you filter out much of the market noise and turn the risk more in your favor.
For those in the bond market, last week’s action was disappointing, and if rates do not start to move lower soon, then we may not see the setback in yields and rise in bond prices that I have been expecting.
As I said last week “For those are not invested in stocks, this is a great time to start a dollar cost averaging program in either a low-cost fund or in an ETF where you do not have to pay commissions. Decide how much you want to invest in total and then break it into five equal parts. Invest the first on August 12 and then equal amounts every two weeks. This will make you fully invested by early October, which is the start of a seasonally strong period”.
Don’t forget to keep an eye on my Twitter feed as I will often Tweet my new recommendations before the opening.
-
Don't forget to read Tom's latest Trading Lesson, An In-Depth Look at 5 Tech Giants.

