Friday's drop may be the first clear sign of a full-fledged summer correction. While a sell-off will create buying opportunities over time, investors need to act now and tune up their portfolios. MoneyShow's Tom Aspray offers this short list of strategies that will allow you to weather the summer while keeping you ready for the next move up.
It has been a very volatile week in many world markets. While much of the attention has been focused on the 5.7% drop in the Nikkei-225 last week, many overlook that the total loss has been closer to 9% in just the past two weeks.
The US stock market looked ready to close the week with slight gains, but then the selling started to pick up just two hours before the close. The selling was very violent in the last 30 minutes, and the Dow lost another 100 points, while the S&P futures dropped more than 15 points.
This was the sharply lower close that I have been warning would signal a start of a full-fledged correction. It has caused the daily technical studies to turn more negative; up until lunchtime, only the NYSE Advance/Decline line actually looked negative. Both the Dow Industrials and the S&P 500 closed below the prior week's lows.
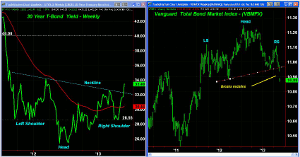
An equally important development last week was in the bond market. The weekly chart of the T-Bond yields has completed its reverse head-and-shoulders bottom formation.
As I noted in last week's Eyes on Income, this indicated that yields could rise from their current level of 3.3% to 4%, which is the upside target from the formation. To complete a similar formation on the ten-year T-Note yield chart, the yield would have to close above 2.39%.
This is already being felt by many bondholders. The chart of the Vanguard Total Bond Market Index (VBMFX), with assets of over $116 billion, also completed its head-and-shoulders top, having gapped below its neckline last week. This fund yields 2.47%, but is already down 3.2% from the July 2012 high of $11.25.
The downside target from the H&S top is in the $10.60 to $10.65 area. Even though the weekly trend is now toward higher yields, it would a very large rise before one could conclude that the 30-plus-year bull market in bonds is really over.
The decline in the junk-bond market has been even more serious. The spread between junk-bond yields and Treasuries has risen sharply, which does not normally occur when Treasury yields rise. In a Wall Street Journal article, they note, "the trading price of a bond issued by Caesars Entertainment [CZR] has dropped 6.7% in just the past eight days."
The flow of money into bond funds this year has been huge, with $187 billion issued so far this year. In January, my analysis of this market, Don't Buy The Junk, suggested that this market should be avoided.
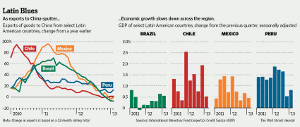
Emerging markets have also had a tough 2013, and most are lower for the year. Latin America has been hit especially hard. The chart above shows that the region's exports to China have dropped steadily since 2010.
Brazil is fighting a weak economy, and their central bank has raised rates to fight inflation. The GDPs of Brazil, Mexico, and Chile are lower in the first quarter of 2013 than they were in the last quarter of 2012.
Though euro concerns have been on the back burner recently, the data for some countries is troubling. Portugal is the latest country where leaving the Eurozone is being discussed. I do expect some negative news from the region to rattle the markets this summer.
In the conclusion of this article, I will suggest four steps you should consider taking to help your portfolio weather the summer months and allow you to relax during your vacation time.
NEXT: What to Watch
|pagebreak|Last week's data on the US economy was positive overall. The S&P Case-Shiller Housing Price Index showed a year-over-year gain of 10.1%, the best one-month reading since 2005.
The consumer also seems to be quite optimistic because of the strong stock market and higher house prices. The Conference Board's Consumer Confidence and the consumer sentiment numbers from the University of Michigan were both better than expected. The sentiment data released on Friday improved 8.1 points from April.
The GDP for the first quarter was revised downward, but is still in a positive trend overall. This coming week, we will also get new readings on manufacturing and the employment situation. The PMI Manufacturing Index and ISM Manufacturing Index both come out Monday, along with construction spending numbers.
Tuesday, we get the latest numbers on international trade, while Wednesday brings the ADP Employment Report, ISM Non-Manufacturing Index, productivity and costs, and factory orders.
Investors hope that the overall downtrend in jobless claims will continue on Thursday, in advance of the monthly jobs report on Friday.
What to Watch
The late-day sell-off and the close of several major averages below the prior week's lows indicates that the May 22 highs will not be challenged for some time.
I would expect further selling this week, though the S&P 500 is likely to bounce from the 1,585 to 1,600 level. A rebound will probably fail around 1,640 to 1,650, and this will need to be watched closely, as it may provide an opportunity to hedge one's portfolio.
In last week's Trading Lesson, I looked at the number of stocks in the major averages that were above their 50-day moving averages. This percentage rises strongly in the early stages of a stock-market rally, but as the market tops out, the number declines—fewer and fewer stocks are pushing the major averages higher. For the Dow Industrials, S&P 500, Nasdaq-100, and S&P 600, the percentages are well below the highs set early in the year.
Bullish sentiment of individual investors reversed last week, as expected. Only 36% are bullish now, down from 49% last week. The number of bears has also increased to 29.6%, up from only 21%. Even the financial newsletter writers have become a bit more cautious as 52.1% are bullish but less than 20% are bearish.
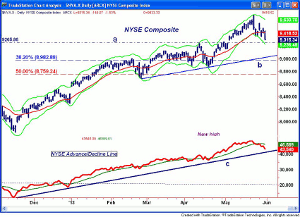
The daily chart of the NYSE Composite clearly shows the key reversal on May 22 and the close below the prior week's low. The daily Starc- band is now at 9261, which corresponds to the April highs (line a).
The short-term uptrend (line b) is now at 9,026, with the 38.2% Fibonacci support from the November 2012 lows at 8,928. The 50% support is at 8,729, which is just above the March lows at 8,700.
The major 38.2% Fibonacci retracement support from the 2011 lows is at 8,441, which is more than 10% below current levels, and also corresponds to the uptrend (line b).
The daily NYSE Advance/Decline line dropped below its WMA on May 23, and is now starting to accelerate to the downside. The daily WMA is now starting to roll over, which is consistent with the top-building process. Its uptrend (line c) may be broken this week before stocks try to rebound.
NEXT: Stocks and Tom's Outlook
|pagebreak|S&P 500
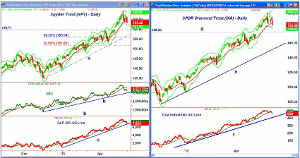
The Spyder Trust (SPY) closed on the lows and below the prior week's low of $163.94. The next weekly support sits at $162.82.
More important support waits at $159.71 (line a), which was the April high. The daily uptrend (line b) is now at $156.69, and the minor 38.2% retracement support follows at $155.94. This is calculated from the November 2012 lows.
The daily OBV did confirm the recent highs before dropping below its WMA. The WMA is flattening out, but the OBV is not far above stronger support (line b).
The daily S&P 500 A/D line turned lower on Friday, and is now closer to support (line c). Resistance for SPY starts in the $167.78 to $169.07 range.
Dow Industrials
The SPDR Diamond Trust (DIA) also plunged in late trading, and closed below the prior week's doji low of $155.14, triggering an LCD. The 20-day EMA is now at $151.74, with next good support from the April high at $148.81 (line d). The uptrend from the November lows is at $142.96.
The daily Dow Industrials A/D line now shows a slight pattern of lower lows. A drop well below the May 23 low would be more negative and suggest a test of the uptrend (line f).
Nasdaq-100
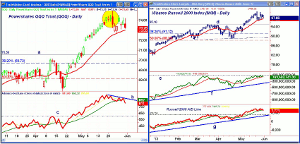
The PowerShares QQQ Trust (QQQ) closed the week just a bit lower, but is still well below the reversal high at $74.95. As you will recall from last week, the reversal triggered an LCD on May 22.
Last Friday's close was near the lows, and the 20-day EMA is now at $73.04. There is additional support at $72.06, which was the last swing low. The monthly pivot support for June is at $71, with the September high (line a) at 70.58. The 38.2% Fibonacci retracement support stands at $69.72.
The Nasdaq-100 A/D line formed a slight divergence on May 22, and shows a clear pattern now of lower highs (line b). It closed the week below its WMA. Next good support waits at line c, which was the April high.
Russell 2000
The iShares Russell 2000 Index (IWM) also closed the week just a bit lower, as well as just above the 20-day EMA at $97. The next support sits at $95.10 (line d), which corresponds to the March highs.
The weekly OBV did confirm the May highs, but the daily OBV (line e) did not. The daily OBV is just holding above its WMA, with next good support at line f.
The Russell 2000 A/D line has been moving sideways for the past two weeks, and is very close to closing below its WMA. The next support can be found at the March highs and the uptrend (line g).
NEXT: Sector Focus, Commodities, and Tom's Outlook
|pagebreak|Sector Focus
The iShares Dow Jones Transportation (IYT) was down again last week, closing just barely above the prior week's lows. Two consecutive lower weekly closes is not a good sign. The monthly S1 support is at $110.31, with the quarterly pivot support at $105.33.
Once again last week the defensive sectors were under pressure. The Select Sector SPDR Utilities (XLU) closed down another 2.2% after losing 4% the prior week. I focused on the utilities sector in an article last week, because I think it is a buy at lower levels.
The biggest loser was the Select Sector SPDR Consumer Staples (XLP), down 3.2%, while the Select Sector SPDR Health Care (XLV) lost 1%.
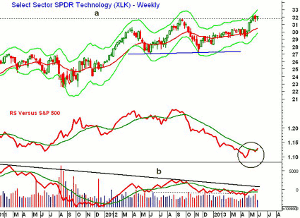
The Select Sector SPDR Financial (XLF) did the best, up about 1.3%, followed by a 0.7% gain in the Select Sector SPDR Technology (XLK). The weekly chart shows that it has been testing its weekly Starc+ band for the past three weeks after breaking out above the September highs (line a).
XLK's weekly relative performance appears to have bottomed, as it has formed higher lows and moved back above its WMA. It will still need to be watched on any further correction. The OBV is trying to turn after testing its WMA, which is also a positive sign.
As I noted in Friday's report Two Signs That Apple Is Bottoming, Apple (AAPL) triggered a monthly HCD on Friday, as it closed above the April doji highs. The daily chart also shows a reverse H&S bottom formation, which has yet to be completed.
Crude Oil
Crude oil closed near the week's lows. The final price was down $2.06 per barrel.
Oil is looking more vulnerable technically. The weekly close was below the prior three weeks' lows, so look for lower prices again this week. The monthly pivot support is at $86.11, which is almost $6 below current levels.
Precious Metals
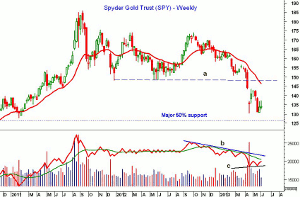
The Spyder Gold Trust (GLD) has been trying to bottom, but was hit hard again last week, as gold dropped over $25 on Friday. It did manage to close the week a bit higher.
The OBV shows a potential bottom formation (line c), but needs to move above its WMA and then the downtrend (line b) to confirm. There is major resistance for GLD in the $148 area.
The Week Ahead
The summer months are often a difficult time for investors, and June is generally a flat month. Since 1950, the S&P has closed up 32 years and down 31. July is a bit better, and August is a bit worse.
The plunge late Friday is what I have been expecting for several weeks, and is why I advised taking some more profits last Wednesday. It was also a strong sign from the markets that now is the time to get your portfolio in order.
Nothing can ruin a summer like going on vacation fully invested only to have the markets go against you. Here are four things you can do to tune up your portfolio for the summer months.
- Check to be sure your diversification matches your goals. Several weeks ago, I expressed my view that many investors do not know what their true portfolio diversification level is, much less whether it meets their needs. Find out now rather than later.
- Adjust the exposure you may have to the long end of the bond market. It will be more vulnerable to higher rates going forward. There should be another pullback in yields in coming weeks that will allow you to reduce your exposure.
- For those who are not in bonds at all, or want to shorten their maturity, consider the bond fund that I recommended last week in my Eyes On Income column.
- Take a hard look at how much you have in the stock market. The major trend is still positive, but you need to ask yourself hard questions. Will you be comfortable with a 5% drop in your stock portfolio? What about 10%? This will help you decide whether you should use tighter stops or reduce your equity exposure for the summer.
There will be some good buying opportunities ahead, but if you are fully invested you won't be able to take advantage of them. There are many good companies and a few countries I am looking to invest in once they get closer to long-term support, where the risk can be better controlled.
Most importantly, have a plan and stick to it, so you will not have to make rash decisions when the market is going against you.
- Don't forget to read Tom's latest Trading Lesson, A Treasure Trove of Technical Tools

