Investors can sometimes find it hard to determine what they really own, in the maze of multiple trading accounts and fund holdings that can easily grow around your nest egg. Still, it's a crucial step to avoid surprise losses, writes MoneyShow's Tom Aspray.
Nervous traders and investors (me included) had quite a bit to cheer about by the end of the week, when the monthly jobs report came in much better than expected.
Things did not look nearly as good in the middle of the week. The ADP jobs report, ISM Manufacturing Report, and the FOMC announcement spooked the markets. The decline on Wednesday caused two important markets, the Dow Transports and Russell 2000, to reverse from important resistance, which had negative technical implications.
Frequently an interim top is confirmed by a sharply lower weekly close. And this looked like a possibility after Wednesday's close.
But the sentiment on Thursday was totally different. After jobless claims dropped to the lowest level in five years, the ECB cut rates and hinted that they were willing to take further action.
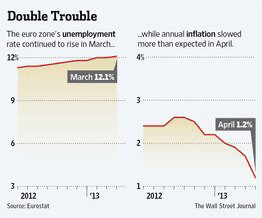
The charts above from The Wall Street Journal show that the ECB's Mario Draghi really had little choice. The unemployment rate has continued to soar, and is now over 12%. The inflation rate, on the other hand, has dropped sharply, and can no longer be used as an excuse not to cut rates.
Needless to say, stocks reversed to the upside Thursday, then moved even higher in reaction to the much stronger jobs report on Friday. All of the major averages closed with nice gains. The trading range in the Russell 2000 was completed with a 2.2% gain, suggesting that stocks can still move significantly higher.
Last week, I recommended that those who were 100% invested in stocks should sell 20% on Monday's open at 1,582.34. Another 20% was sold today, as the S&P 500 has hit a high of 1,618, which was above my 1,615 target. I am still comfortable with that recommendation: if you are 60% long, you should be well positioned for now.
But how much should one have in stocks and bonds? The traditional 60% in stocks and 40% in bonds has come under fire recently. Some experts feel that someone in his or her 40s should have more than 60% in the stock market.
The recent decline in yields from the January highs is an indication that many still do not trust stocks, so they are flocking to the safety of bonds. But how much lower can yields go? If the economy continues to get better as the numbers suggest, rates will inevitably move higher as the Fed's targets are reached.
For those holding 30-year bonds, a 1% rise in rates translates to a 20% drop in the bond price. For those in ten-year T-Notes, a 1% rise would mean a 9% drop in the T-Note's price.
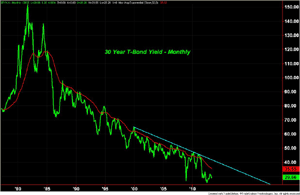
The 30-year-plus bond bull market is reflected by this long-term chart of T-Bond yields by year-they have declined from 15.2% to 2.91%! But this can't last forever.
The rally in yields from last summer's lows may be the first part of the bottoming process, but clearly there are no signs yet that yields have bottomed or bonds have topped.
This, of course, raises a larger question: do you really know who much you have in bonds, stocks, or other asset classes? If your diversification isn't what you think it is, it could seriously impact your returns.
NEXT: Most Investors Don't Really Know What They Own
|pagebreak|Last fall, I had the pleasure of speaking with Bill Harris. Bill is CEO of PersonalCapital.com. Those not familiar with this company will surely recognize Bill from his past as CEO of both PayPal and Intuit.
I know that most investors and traders have multiple accounts, and often do not have a clear understanding of what percentage they have in different asset classes. Having looked at quite a few portfolios, I have often found that the actual asset mix is much different than what the investor intended.
In my conversation with Bill, I was introduced to an interesting tool that allows you to amalgamate all of your accounts from different sources and graphically display what you have in different asset classes. This is a free tool which can be found on the their Web site.
As part of the free service, you are sent an e-mail each weekend updating you on how your portfolio performed that week. Their ultimate goal is the management of a client's portfolio, and they provide a number of other services.
I have used the portfolio analysis feature and found that it worked quite well. (Of course, I have no financial connection with their firm.)
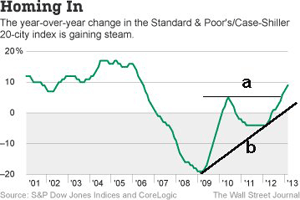
There was other positive data last week, as this chart of year-over-year change in the S&P Case-Shiller housing price index looks very bullish. It shows an uptrend from the 2009 lows (line b), and then a breakout above resistance (line a).
Factory orders on Friday were lower than anticipated, however. The ISM Non-Manufacturing Index fell for the second month in a row, and at 53.1 was below the consensus estimate of 54.
Overall, this has been a much better than expected earnings season. While the market has punished some that missed, other stocks have moved higher just because their earnings were not as bad as expected.
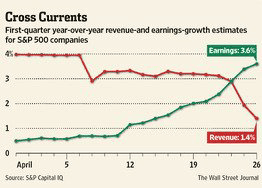
The chart shows that while there has been a nice growth in earnings, the revenues have been falling. This reflects the results from 272 members of the S&P 500, and at the beginning of April they were looking for just a 0.5% gain versus a year ago. They were also off on the revenue side, as they were looking for a gain of 4%-not the current 1.4% reading.
This week, there is a very light calendar. Jobless claims out on Thursday, and Ben Bernanke will make a speech on Friday.
What to Watch
The action last week was clearly very impressive. Specifically, the PowerShares QQQ Trust (QQQ) has finally started to catch up to the Spyder Trust (SPY). It is now up 10.8% for the year, while the SPY is up 13.5%. Of course, much of the gain in the QQQ has come in the past week or so.
Despite the continuing improvement in the market internals of the NYSE and S&P 500, I have clearly been too cautious over the past month or so. The deterioration in the Dow Transports and Russell 2000, as well as the declining T-Note yields, kept me from being a more aggressive buyer.
NEXT: Tom's Outlook for Stocks
|PAGEBREAK|Missing opportunities is one thing; there will always be new ones. However, taking more aggressive positions when the risk is too high and the technical outlook is mixed can often result in disaster.
The upside breakouts do allow for more potential. The challenge will be to find those stocks where the technical studies are just turning positive, then finding a reasonable risk entry.
According to AAII, bullish sentiment has continued to edge higher. It's now at 30.9%, up over 4% in the past three weeks. The bearish percentage has seen a 12% drop during the same period.
The financial newsletter writers are also a bit more bullish, at 47.9%, up from 44.3% last week. This numbers have not reached either bullish or bearish extremes since the fall of 2011.
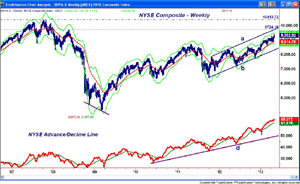
On the long-term weekly chart of the NYSE Composite, it is difficult to see last week's breakout.
It does show that it is still about 360 points below the May 2008 high of 9,724. This also corresponds to the upper boundary of the trading channel (line a). It would take another 4% rally to reach this level, with the all-time high from 2007 at 10,413.
The weekly Starc+ band is now at 9,511, and the breakout from the daily trading range has upside targets just above 9,600. As I noted last week, the weekly NYSE Advance/Decline continues to act quite strong. With new highs again this week, there are no signs that it is topping out.
There is minor support for the NYSE Composite at 9,179 with the 20-week EMA at 8,914.
S&P 500
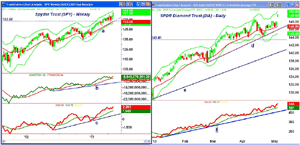
The weekly chart of the Spyder Trust (SPY) reveals the convincing close above the quarterly R1 at $160.31. The weekly Starc+ band is now at $164.06, with the quarterly R2 resistance at $164.58.
The weekly on-balance volume (OBV) has turned up from its WMA, and is very close to new highs. The OBV broke out of its trading range early in the year. The OBV has long-term support at the uptrend (line b).
The weekly S&P 500 A/D line clearly made new highs last week, as did the daily (not shown). The fact that its WMA is also rising quite sharply is positive. There is a band of first support now at $158.70 to $159.70, with key support still at $153.55.
Dow Industrials
The SPDR Diamond Trust (DIA) gapped higher on Friday, and is not far below the daily Starc+ band at $160.56. The fact that the Dow Industrials broke the 15,000 level is likely to get some press after Friday's close. The measured upside target from the trading range is now at $153 to $154.
The daily Dow Industrials A/D line once again made new highs last week, as it held above its rising WMA on the pullback.
DIA came quite to its 20-day EMA on Wednesday's sharp down day. The fact that the EMA was rising was a positive sign. There is first support at $147.40 to $148, with the 20-day EMA at $146.24.
NEXT: More Stocks and Sector Focus
|pagebreak|Russell 2000
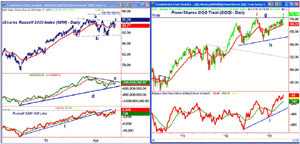
The iShares Russell 2000 Index (IWM, chart below) rallied toward the recent high at $94.67 on Tuesday, then reversed to the downside Wednesday, dropping well over 2%.
If IWM had closed lower again on Thursday, it would have had quite negative implications, but that did not happen. Instead, it closed back above its 20-day EMA, and then gapped higher Friday, closing above the resistance (line a).
This completed the flag formation, with the 127.2% Fibonacci target at $96.93. The measured target from the flag formation is in the $99 area.
The OBV is back above its WMA, but has not yet confirmed the upside breakout or the new highs. The volume was three times the average on Wednesday's drop, but was just average on Friday. The OBV is still in a long-term uptrend (line d).
The Russell 2000 A/D line broke its uptrend (line f) in late March, then made slightly lower lows. It was very strong this past week: after testing its WMA on Wednesday, it moved to new highs, erasing any negative divergences.
There is a band of support now at $91.76 to $94.14.
Nasdaq-100
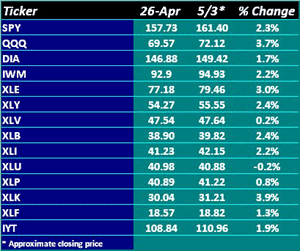
The PowerShares QQQ Trust (QQQ) closed the week well above the September 2012 high at $70.58. It was the best performing ETF (see table on next page), as it gained 3.7% for the week.
At the September 2012 highs, a doji was formed, and the following week an LCD was triggered.
The weekly Starc+ band is at $72.55, with the monthly at $75.80. The breakout completed a trading range that is about ten points wide, so it gives upside targets in the $80 to $81 area.
The weekly Nasdaq-100 A/D has turned up sharply, while the daily A/D (not shown) broke its uptrend before reversing to the upside. It is now rising at a very sharp angle.
There is first support now at $69.79 to $70.58, with much more important levels at $66.88 and the rising 20-day EMA, with the monthly pivot at $68.19.
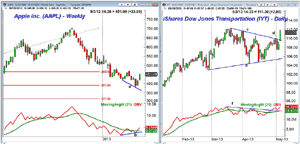
Apple (AAPL) has bounced from its recent low at $385.10, and now appears to have completed a weekly bottom formation. The 50% Fibonacci support at $391.64 that goes back to the 2009 lows was slightly violated.
As AAPL was making lower lows (line a), the OBV was making higher lows (line b), forming a bullish divergence. The OBV has now moved above its flattening WMA. AAPL is now at first resistance and a pullback looks likely, which should set up a buying opportunity.
Sector Focus
The iShares Dow Jones Transportation (IYT) tested its downtrend (line c) on Tuesday before it dropped sharply Wednesday.
The close on Friday was well above the prior high of $110.50, as the continuation pattern (lines c and e) appears to have been completed. There is next resistance at the all-time high of $112.30.
The daily OBV broke through its resistance (line f) at the end of April, and now shows a positive zig-zag formation. The weekly OBV (not shown) has turned up from its rising WMA, so the multiple time frame OBV analysis is positive.
NEXT: More Sectors, Commodities, and Tom's Outlook
|pagebreak|All of the sector ETFs were higher last week except for the Select Sector SPDR Utilities (XLU), which was down a fraction.
As the table above indicates, the Select Sector SPDR Technology (XLK) did the best, up around 3.9%, followed by the Select Sector SPDR Energy (XLE), which gained 3%.
From a technical perspective, the Select Sector SPDR Materials (XLB) is now just testing the twin peaks from January and March, so an upside breakout would be important.
Neither the Select Sector SPDR Health Care (XLV) nor the Select Sector SPDR Consumer Staples (XLP) made new highs for the year, but both closed up.
Crude Oil
Crude oil also had a wild week. After dropping sharply on Tuesday and Wednesday, it also reversed to the upside and closed above the prior week's high. It was up $2.70 per barrel for the week. The weekly OBV has turned up, and is trying to close back above its WMA.
Precious Metals
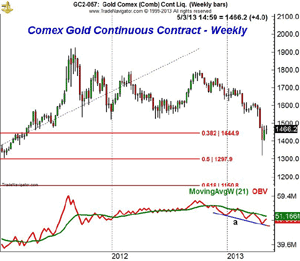
The Spyder Gold Trust (GLD) was also up for the week, but not by much. At this point, it just looks like an oversold rally that could end this week. The chart of the gold futures shows that it has dropped into the 50% Fibonacci support zone from the 2008 lows.
The weekly OBV continues to look weak, as it has since earlier in the year. It has formed a pattern of lower lows (line a). Some of the miners I discussed in Most Oversold Gold Miners have also rebounded, but they should still be avoided for now.
The Week Ahead
After last week's action, the focus is clearly back on the upside. It looks as though the Veg-O-Matic market I referred to early March is finally over. It certainly lasted longer than I thought it would.
The challenge will be to find stocks with positive volume, and that are close to good support where a tight stoop can be used. It appears that the China ETFs have bottomed, and if they get a bit of a pullback, we may get a reasonable entry point.
It is not a time to buy at any price, as we are still likely to see a sharper correction in the coming months that should provide much more favorable entry points. Ideally, we will get an environment like the middle of last December, when no one wanted stocks and most were selling.
- Don't forget to read Tom's latest Trading Lesson, A Candle Trigger for Market Bottoms

