The Chinese zodiac may have played a role in investors' good fortune last year, but if so, you may not want to hear what the calendar predicts this year. In any event, MoneyShow's Tom Aspray explains why at least in the short term, not chasing this rally might be the prudent choice.
The stock market was choppy for most of last week, but then turned higher Friday in a more convincing fashion. The strong close does favor another push to the upside this week.
As I discussed at the end of last month, the stock market has a seasonal tendency to correct in February, and the sharp gains so far in 2013 make this a distinct possibility. The technical action remains positive and shows no signs yet of a top, but this could change in the next two weeks.
Sunday is the beginning of the Chinese New Year. This is the year of the “Black Water Snake,” and runs through January 31, 2014.
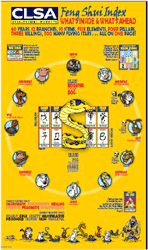
I just received the annual copy from CLSA Asia-Pacific Markets of their CLSA Feng Shui Index(CLSA FSI). This is their “tongue-in-cheek look at what’s in store for the Hang Seng key market sectors” for the coming year. As the cover suggests, it is geared more toward the Hang Seng and Chinese investors...it is quite detailed, but does has some interesting information.
It does mention that those who were born in the year of the Rooster, Dog, and Cow will have the best year. Those of us who were born in the year of the Pig, Tiger, Snake, or Sheep will not be as happy. (To find your Chinese Zodiac sign, please click here.)
In my column last year, Year of Dragon Is Bullish for Stocks, I noted that the “since 1952, there have been four other Dragon years as part of the 12-year cycle. The average for the five years is a gain of 5.8% using the Dow Industrials before 1980 and the S&P 500 in later years.”
With an average Dragon-year gain of 5.8% in 2012, it “would mean that the S&P 500 would close on February 9, 2013 at 1391.57.” So clearly, the last Dragon year was better than average. The last three Snake years have been 2001, 1989, and 1977.
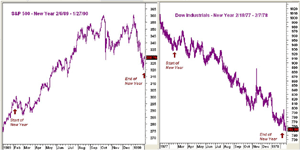
In my discussion of the January barometer, I noted that 2001 was an ugly year for the stock market. On a year-to-year basis, the S&P 500 was down 13.1%, and at one point was down almost 28% for the year.
The chart of 1989 does look much better, as the S&P was up over 27% for the year. However, for the Chinese year period it was not nearly as good—it began the Chinese year at 296.9 and ended it at 325.8, for just a 9.7% gain. There were some definite sharp drops along the way, including the 6.1% drop on October 13, 1989.
Using the Dow Industrials in 1977, it was pretty grim no matter whether you look at the calendar year or the start and end of the Chinese year. For the calendar year, the Dow was down 16.8%, and for Chinese year it lost 17.5%.
NEXT: What Does This Mean for 2013?
|pagebreak|Though I certainly do not invest based on the Chinese calendar, I do find the history interesting, as in both 2001 and 1989 there was quite a bit of global turmoil. This includes the horrible events of 9/11, and in 1989 there was the fall of the Berlin Wall, the Tiananmen massacre, and the top in the Japanese stock market.
It should also be pointed out that 1965 (Vietnam War, the Watts riots) and 1941 (Pearl Harbor) were also both Snake Years. Of course, given our impending storm, it is worth mentioning that the Blizzard of the Century came in early 1978, right before the end of the Snake year of 1977, which also saw the Great Blackout and Son of Sam hysteria.
Getting back to 2013, the global markets have been acting well, as euro fears dissipated last week. Strong earnings reports from companies like LinkedIn (LNKD) pushed not only its stock sharply higher, but also supported the market.
The economic news was generally upbeat. The generally volatile factory orders were up 1.8% last Monday, and Tuesday’s ISM Non-Manufacturing Index reflected rising momentum for the job market. The week ended with a smaller than expected trade deficit, which caused many economists to raise their GDP forecasts.
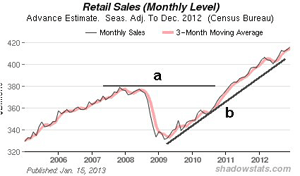
The first widely watched economic report this week comes on Wednesday with retail sales. The same-store sales reported last week showed strong January numbers, and the longer-term chart shows a solid uptrend (line b) and the breakout in 2011 above the 2007-2008 highs (line a).
On Thursday, we get weekly jobless claims, and then Friday follows with the Empire State Manufacturing Survey and industrial production numbers, as well as the preliminary consumer sentiment report for March.
What to Watch
The S&P 500 came close on Friday to the upper boundary of my target zone at 1,520. This was the sixth higher weekly close in a row, though for the first time this year, the S&P 500 did drop briefly below the prior week’s lows.
Though many market skeptics have thrown in the towel, there are a few still out there. One often-interviewed analyst last week said he was the shortest he has ever been. This is the kind of sentiment that can help move the market higher.
The individual investor has become a bit more nervous, as the press seems to be focused on the inflow of funds to stocks and the generally poor record of the individual. Only 42.4% are bullish now according to AAII, down from 52.3% on January 24. The percentage of bears has crept up to 29.4%. The number of bullish financial newsletter writers was up a bit to 54.7% while the number of bears dropped to 21.1%.
Clearly, this is not the time to be an aggressive buyer—or even simply complacent. Right now, it is even more important to pay attention to the risk on any new positions and to take some profits off the table. The retail stocks I recommended last week, Target Corporation (TGT) and Tumi Holdings (TUMI), had just moved out of tight ranges where the risk could be kept to under 4%.
I am becoming more selective, and will likely do some more portfolio pruning next week. However, strong action Friday in the Powershares QQQ Trust (QQQ) does raise the possibility that the tech sector could fuel another significant push to the upside.
NEXT: Stocks and Tom's Outlook
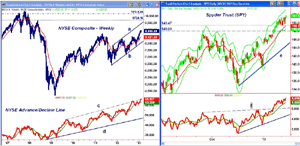
|pagebreak|The weekly chart of the NYSE Composite continues to look strong, even though it was a bit lower last week. The all-time highs from 2007-2008 are considerably higher at 9,724 and 10,178.
The NYSE Advance/Decline closed at another new weekly high, and is well above the highs that it made in 2007-2008. It just recently broke out of its consolidation pattern, which indicates the market can still go higher.
The rising 20-week EMA has moved up to 8,491, which is 4.8% below Friday’s close. Though not shown on the chart, the NYSE did come close to the 20-day EMA last week, which is now 8,831. There is first meaningful chart support in the 8,550 to 8,700 area.
S&P 500
The Spyder Trust (SPY) broke out of its recent trading range last Friday, with the next resistance at the longer-term trend line at $153.12. The quarterly R2 resistance is at $155.10, and the all-time high is not far away, at $157.42.
The S&P 500 Advance/Decline line confirmed the price action on Friday, as it also made new highs and is still in a strong uptrend. The A/D ratios were about 2:1 positive on Friday. The breakout above the December high (line f) in January was a very bullish signal.
The 20-day EMA is at $149.37, which is just below the chart support at $149.47. There is a band of more significant support now in the $148 area. There is much stronger support now in the $146.52 to $147.30 area.
Dow Industrials
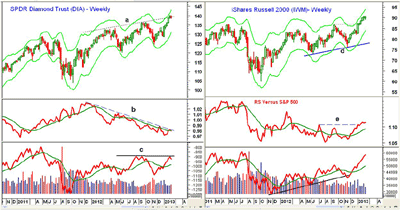
The SPDR Diamond Trust (DIA) closed a bit lower last week, as it was not able to break out of its recent trading range like SPY did. It is still holding above the resistance that connects the highs from 2012 (line a).
The weekly Starc+ band will be at $143.09 this week, and there is minor support at $138.32, which is the low of the past two weeks. The monthly pivot line and further support waits at $137.19.
The Dow Industrials A/D line (not shown) is still holding up well, above its rising WMA. The weekly relative performance is still in a downtrend (line b), which means it is still underperforming the S&P 500.
The weekly OBV did turn lower last week after failing to move above last September’s highs. It is still well above its rising WMA.
Russell 2000
The iShares Russell 2000 Index (IWM) closed the week higher last week and above the quarterly R1 at $90.60. The quarterly R2 resistance is at $94.06, which is very close to the weekly Starc+ band.
The Russell 2000 A/D line (not shown) did make slightly higher highs on Friday. The relative performance continues to move higher, and its WMA is clearly rising.
The weekly OBV has been very strong over the past few weeks, and is now close to the highs made in 2011. It is well above its WMA, but shows no signs yet of topping. The daily OBV (not shown) is also confirming the price action, so the OBV multiple time frame analysis is still positive.
There is support for IWM now at $88.60 to $89.70, and the monthly pivot support is at $87.
NEXT: Sector Focus, Commodities, and Tom's Outlook
|pagebreak|Nasdaq-100
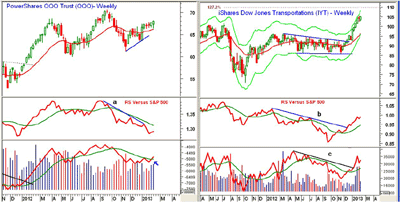
The PowerShares QQQ Trust (QQQ) is starting to act better, as it opened strong last Friday and had its highest close since the middle of last October. The 20-week EMA is starting to turn up, and a close above the weekly high at $68.72 should confirm a stronger tally and a challenge of the highs.
The relative performance has risen over the past two weeks, but is still well below its WMA and its downtrend. The daily RS line moved back above its declining WMA on Friday. The weekly OBV does look better, as it has now moved above its WMA for the first time since October. This makes the close this week more important.
There is good support for QQQ now at $65.50 to $66.60.
Sector Focus
The iShares Dow Jones Transportation (IYT) closed up over 1% last week, having been on a tear since the November lows, gaining over 20% in that span. The weekly chart shows that prices have been testing the weekly Starc+ band over the past three weeks, with the 127.2% Fibonacci target at $110.
The relative performance broke through its resistance (line b) a week ahead of prices, and continues to act strong. The weekly OBV pulled back two weeks ago, but has now turned up once more.
The ranges in the sector ETFs were pretty small last week, as most closed with just minor gains. The Select Sector SPDR Energy (XLE) was up 0.6%, while the Select Sector SPDR Technology (XLK) gained 0.7%. The Select Sector SPDR Financial (XLF), Select Sector SPDR Utilities (XLU), and Select Sector SPDR Materials (XLB) all showed slight losses.
No real change for my Sweetest Sectors of 2013, but I may take some profits this week. Several of the sector ETFs are starting to look overextended.
Crude Oil
The April crude oil contract closed the week down $1.84 per barrel, but the volume was the lowest of the past few weeks. Still, the weekly OBV has turned lower, and we may see a further pullback. Good support sits in the $95 to $93.50 area.
The weekly and daily OBV look strong, as volume surged in January. There is first good support now in the $94.50 to $95.80 area.
Interest Rates
The bond market has continued to get quite a bit of attention lately, as some are convinced that the major flow of money from bonds to stocks is underway. I am not convinced that this is really occurring.
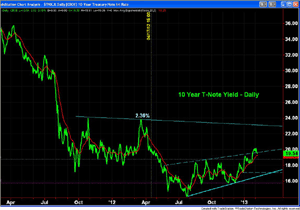
The yield on the ten-year T-Note did close a bit lower last week, its daily uptrend (line a) is at 1.65%, with minor support now in the 1.8% area.
Precious Metals
I took a long- and short-term view of the SPDR Gold Trust (GLD) last week, as the technical action and the negative sentiment by futures traders suggested the risk was acceptable on new long positions.
More aggressive investors went long on last Thursday’s opening, which was just below the week’s close. GLD needs a couple of strong up days to complete its bottom.
The Week Ahead
Stocks again finished the week strong, which is a sign of a healthy market, as investors and apparently some traders are willing to hold long positions over the weekend. There isn't really much change in my view, though I will be watching the technology sector closely, as it could push the S&P 500 toward 1,550.
Apple (AAPL) was in the news last week. While the short-term technical action suggests we may have seen a selling climax, we are still on the sidelines. It is certainly a stock that could cause other stocks to accelerate higher.
I will be updating the Charts in Play portfolio early this week, and will likely take some more profits. For those who are not invested, try to avoid the urge to buy now, as the risk is high and there will be a better opportunity later in the year.
- Don't forget to read Tom's latest Trading Lesson, The Best Volume Indicator.
- Editor’s Note: If you’d like to learn more about technical analysis, attend Tom Aspray’s workshop at the Traders Expo in New York, February 17-19. You can sign up here. It's free!

