A test of all-time stock highs looks highly likely next year, but the market's reaction to fiscal cliff news shows us that caution is in order for the very near term. MoneyShow's Tom Aspray finishes off a highly successful year by determining where smart investors should position themselves for maximum advantage as we enter the new year.
The stock-index futures plunged Thursday night, with the S&P futures dropping an astounding 40 points on Boehner’s failure to get enough votes from his own party. This may mean we will see a viable third party in the coming years.
Stocks did manage to close well above the early lows, and despite Friday’s drop, there was actually some technical improvement last week. The market internals have started to act stronger than prices, which is what is needed for a sustainable new intermediate uptrend.
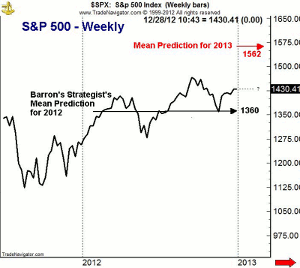
In last week’s issue, Barron’s came out with its annual survey of top Wall Street strategists. The mean forecast for 2013 from the ten strategists is for a 10% gain or a target in the S&P of 1,562. The most bullish is Stephen Auth from Federated Investors, who is looking for 1,660 on the S&P. His target for 2012 was 1,450.
Morgan Stanley’s Adam Parker is this most negative. He's looking for 1,434, which is reflects little change for the year. He was also the most negative for 2012, as his target was 1,234, which is 13.7% below current levels.
As the chart indicates, the mean prediction for 2012 was 1,360, which is about 5% below the current level of 1,430. For 2012, John Praveen, chief investment strategist at Prudential International, and JPMorgan's Thomas Lee both had targets of 1,430, which appear to be right on target. For 2013, their targets are 1,600 and 1,580 respectively.
These forecasts are based primarily on fundamental analysis. Surprisingly, most are only looking for modest growth in S&P earnings next year. From a technical perspective, the continued bullish signals from the market internals like the NYSE Advance/Decline line make a test of the all-time highs at 1,565 a good possibility sometime in 2013
The new highs in the A/D line last April kept my intermediate-term outlook positive for the year, as I was looking for a year end rally last June. Of course, the A/D line made another new high in October and last week, which reaffirms the positive outlook.
The relatively low public interest in the stock market that I discussed last week means there is plenty of cash on the sidelines, which could fuel a significant rally even from current levels. The next few weeks are likely to be problematic, but once the stalemate is resolved, stocks should do well in the first quarter of 2013.
As the year draws to a close, the upgrading of Greece’s debt was a pleasant surprise. Though the Euro crisis is a long way from being over, we may have a few months where it is on the back burner for a change.
The best news as we head into 2013 is the turnaround in the Chinese economy. I was never in the hard-landing camp, and their economy is likely to be a plus for many of their neighbors, including their stock markets. I will be looking to add to positions in the global ETFs on a correction, as the overseas markets have looked better than the US for several months.
NEXT: US Economy and What to Watch
|pagebreak|The economic news last week started off poorly but closed fairly strong. Monday’s Empire State Manufacturing Survey was disappointing, as it continues to indicate contraction.
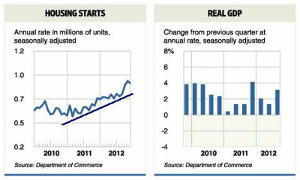
Tuesday’s Housing Market Index revealed that homebuilders have the best outlook in five years, and while housing starts Wednesday were a bit lower in November, the chart does show a healthy uptrend.
On Thursday, the GDP estimate for the third quarter was revised up to 3.1%, which is the best reading of the year. Existing home sales surged 5.9%, and the Philadelphia Fed Survey was much better than the previous month. The week ended with a slight increase in durable-goods orders, while consumer sentiment continues to drop as concerns over the fiscal cliff mount.
Even though we have just a half day of trading Monday, followed by the Christmas holiday, there are several notable economic reports. The S&P Case-Shiller Housing Price Index comes out on Wednesday, and new home sales numbers follow on Thursday.
Friday brings the Chicago Purchasing Managers Index and pending home sales. Of course, the main focus toward the end of the week will be on the supposed resumption of the fiscal cliff negotiations.
What to Watch
The strong action of the market internals early last week was dampened somewhat by the sharp market decline Friday. Nevertheless, the major market averages did close the week higher and are still holding well above support, suggesting that the current correction should be a buying opportunity.
According to option expert Larry McMillan, “the equity-only put-call charts continue to remain strongly on buy signals.” This suggests that the bulls can ride out the current storm.
The individual investor continues to get more positive, as 46.4% are now bullish and just 24.8% are bearish. There was little change last week from the financial newsletter writers, as the percentage of bulls rose slightly to 46.8%.
I continue to favor stocks in my four favorite sectors, and a decent pullback in the two industrial stocks I recently recommended should present a good opportunity.
NEXT: Stocks and Tom's Outlook
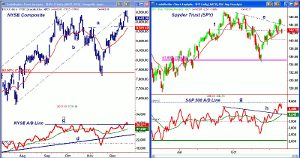
|pagebreak|The NYSE Composite surpassed both the October and September highs last week before Friday’s drop. The first strong support is in the 8,350 area (line a) and the 20-day EMA. There is more important support at 8,200, which was the early December low.
The daily NYSE Advance/Decline line was able to move to new rally highs, as the resistance (line c) was overcome. The A/D line dropped back below the breakout level Friday. It is still in a clear uptrend and above its rising WMA.
S&P 500
The Spyder Trust (SPY) made a high last week at $145.58, which was just below the monthly R1 pivot resistance at $145.68. SPY gapped lower Friday, but is holding above the quarterly pivot at $141.69.
The 20-day EMA at $142.70 was being tested on the close, with more important support at $140.37, which was the December 5 low. The minor 50% Fibonacci retracement support sits at $140.11.
The S&P 500 A/D line made convincing new rally highs last week, as both the September and July peaks were overcome. The A/D line also reached the May highs (line g), with next major resistance at the April highs.
The A/D line was stronger than prices last week but could retest its breakout level (line h) and its WMA on a further correction.
Dow Industrials
The SPDR Diamond Trust (DIA) slightly exceeded the monthly R2 pivot resistance at $133.68 before gapping lower Friday. The next band of good support is in the $129.16 to $130.80 area.
The Dow Industrial A/D line (not shown) did move above its April-May highs last week. This new high is bullish for large-cap stocks, as DIA is still well below its bull-market high of $136.48.
There is next support for DIA at $130.65, as it closed just a bit below the 20-day EMA. More important support waits at $129.16, which was the November low.
Nasdaq-100
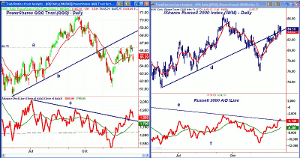
The PowerShares QQQ Trust (QQQ) is still the weakest of the major averages, as it moved briefly above the resistance at $66.39 before gapping lower Friday. The low on Friday was close to support at $64.44, which is the monthly pivot. The short-term 50% retracement support is now at $64.02.
The Nasdaq-100 A/D line was stronger than prices last week, as it made new rally highs and is well above the former downtrend (line c). It still shows a pattern of higher highs and higher lows with its WMA rising strongly.
There is first resistance now at $65.70 to $66.70, and then in the $68 area.
Russell 2000
The iShares Russell 2000 Index (IWM) held up better than SPY and the other major averages Friday, suggesting that the January effect is already taking hold. Small-cap stocks, ETFs, and funds are therefore favored on a further pullback, as they should continue to outperform in January.
Once above last week’s highs at $84.77, the next major resistance is at $85.25 to $86.08.
The Russell 2000 A/D line finally overcame the bearish divergence resistance last week (line e) that goes back to the February highs. It dropped back below the breakout level Friday, and new highs are needed on the next rally to confirm the breakout.
There is first support for IWM at $82.16, with more at $81.40. The monthly pivot support is at $80.39, with the November low at $79.63.
NEXT: Sector Focus, Commodities, and Tom's Outlook
|pagebreak|Sector Focus
The iShares Dow Jones Transportation (IYT), like IWM, held up very well on Friday, closing down about 0.5% as the early selling was well absorbed. As I noted last week, the transports have been outperforming the industrials recently
It would be a very positive sign for the market in 2013 if the transports can overcome its divergences with the industrials.
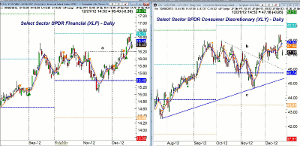
As one would expect, all of the ETFs were hit Friday, with the largest losses in the market-leading Select Sector SPDR Financial (XLF)and the Select Sector SPDR Consumer Discretionary (XLY), which were both down over 1% on the day.
The Select Sector SPDR Energy (XLE)and Select Sector SPDR Technology were also down 1% or more. The Select Sector SPDR Utilities (XLU) were flat for the day.
The daily chart of the Select Sector SPDR Financial (XLF) shows the sharp rally from the November lows, as quarterly R1 resistance at $16.70 corresponds to last week’s high. There is initial support now at $16.20 (line a), with further at $15.80 to $16.
The Select Sector SPDR Consumer Discretionary (XLY) gapped lower Friday, and the weak consumer sentiment numbers did not help. The break of the downtrend (line b) in November confirmed that the correction was over. There is next support at $46.40 to $46.80 with the quarterly pivot (blue line) at $45.74.
Crude Oil
The February crude oil contract was down over $1.30 per barrel Friday, but still closed the week higher. The technical action still suggests that crude oil is bottoming, and a close above last week’s high at $90.54 would be positive
There are still no strong signs from the relative performance or RS analysis that the energy sector is ready to lead the S&P 500, but I am watching it closely.
Precious Metals
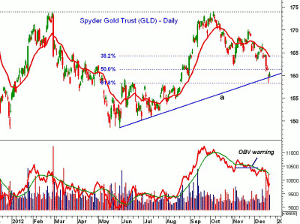
It was a rough week for the metals, as the heavy selling I observed last month in "Two Paths for Precious Metals" was indeed sending a warning. The Spyder Gold Trust (GLD) rebounded Friday, but still was down over $3.70 for the week.
GLD came close to the 61.8% support at $158.29 last week, as the uptrend (line a) was tested. There are no signs yet of a bottom, and if this level is broken a drop back to the $155 area is possible. The longer-term analysis still suggests a turnaround in 2013.
The Week Ahead
Even though stocks were hammered early Friday, they closed well above the early lows. S&P futures hit a low of 1,391.25, but closed at 1427.50.
The improvement in the market internals does not suggest that we will see more than a few days of selling, but the test is likely to come after Christmas.
Some of the buy zones in my recently recommended stocks are likely to be hit on this decline, but most of them are placed near good support. The small-cap ETFs and closed-end funds look like the most conservative plays as we head into 2013. The equity income funds I reviewed a few weeks ago also deserve consideration.
It will take a deeper correction in the global ETFs to take them back to good support, and we may have to wait until they develop new trading ranges before we get a good entry.
This is the last Week Ahead column for 2012, as the next column will be published on January 4. My best wishes to all of you for the holidays, and thank you for all of your support in the past year.
- Don't forget to read Tom's latest Trading Lesson, The Most Powerful Pivot Level

