A fascinating comparison of today's market with the 1970s may mean stocks could be the best Christmas gift this year. Also, MoneyShow's Tom Aspray navigates the fiscal cliff to find his best picks for what could be choppy markets through the holiday season.
By the middle of Friday's session, stocks were still marginally higher for the week, though Thursday's drop has taken the major averages below their best levels.
The news of the Fed's $85 billion plan to keep rates low until unemployment drops spurred a quick 80-point rally in the Dow, but it only ended the day a bit lower.
The Fed hopes that an extended period of low rates will make other investments, like stocks, more attractive. It is my view that it will ultimately be bullish for stocks, but it will likely take a resolution of the fiscal cliff and debt ceiling to encourage companies to start spending again.
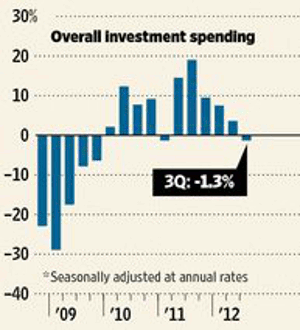
The chart above shows that overall investment spending was negative in the third quarter for the first time since the first quarter of 2011. In 2011, spending increased sharply for the rest of the year, and a similar turnaround in 2013 should give the corporate earnings a nice boost.
Of course, it may take more than that to encourage the individual investor to buy stocks again. The bear market in the 1970s dropped the stock market 45%, and the 1973 highs were not exceeded until 1982. Over the next ten years or so, interest in stocks reached a very low point, as money was not even moving into mutual funds.
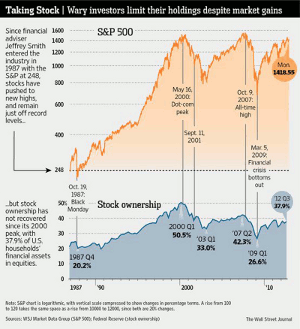
Sound familiar? As this chart from The Wall Street Journal indicates, in 1987 only 20.2% were invested in stocks. This was well after the bull market lows in 1982.
As the technology sector peaked in 2000, this number had risen to 50.5%, up 20% from 1995 to 2000. This reinforces the long-held belief that the public is selling when they should be buying, and tend to only get back into stocks as the market is near a top.
At the end of the bear market, only 33% were invested in stocks, with the level peaking at 42.3% in 2007 . As of the third quarter of 2012, just 37.9% are invested.
If you read the analysis of the 1970s, there are many parallels to current investor attitudes, suggesting that history is indeed repeating itself. For those not invested in stocks at all, I would suggest you start to put even a small amount regularly in a low-cost mutual fund or ETF.
NEXT: US Economy and What to Watch
|pagebreak|The final two weeks of the year could be very choppy, as we get closer to the fiscal cliff and portfolio managers do their year-end portfolio window dressing. This is when managers buy the year's best performers and sell the worst so their portfolios look better at year-end.
In addition to the FOMC meeting, there was also a Eurozone summit, wherein leaders agreed to move toward the formation of a banking union within the Eurozone. While this was an encouraging step, they put off until next year any decision to further integrate their economies and fiscal policies. The finance ministers also agreed to release the $57 billion of new funds to Greece.
Last week's economic data was generally positive. Retail sales were up but below estimates due to the sharp drop in gasoline prices. On Friday, the flash PMI Manufacturing Index rose to 54.2, which was well over 50 and indicated growth in business activity.
Industrial Production was also out last Friday, and it rose the most in two years in November. It was much better than most economists had forecast.
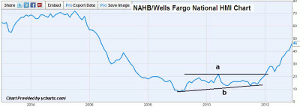
This week, we get the Empire State Manufacturing Survey on Monday, followed by the Housing Market Index on Tuesday. For a technical perspective, this index completed a bottom early in the year when resistance (line a) was overcome, completing a major base on the weekly chart. It continues to look very strong.
On Wednesday, we get the latest reading on housing starts, followed on Thursday by existing home sales. Also on Thursday is the final GDP for the third quarter, as well as the Philadelphia Fed Survey. The week ends with personal income and outlays as well as the final reading for the month on consumer sentiment.
What to Watch
This week, we are publishing early and are
only able to use data up through noon. This week, the Dow Industrials, S&P
500, and Russell 2000 made new rally highs, but the Nasdaq-100 did not.
The decline Thursday and early weakness on Friday reaffirms the short-term deterioration that was evident after last Wednesday's close. This was discussed in detail in Thursday's "Another Round of Cliff Selling?" The major ETFs are still above the initial support levels I mentioned in the article, so this week's review will be abbreviated.
If stocks close the week lower, it will increase the downside momentum, but it could be reversed if Washington calms the markets with a fiscal-cliff resolution.
I still think that the current decline will provide an opportunity to buy stocks at stronger support where the risk is better controlled. This is what I referred to recently as smart buying, as it is important to minimize the risk on any one position.
The individual investor has become a bit more positive on stocks. According to AAII, 42.2% are now bullish. The number of bears has also dropped sharply: on November 15, 48% were bearish, but this number has now dropped to 30%. The number of bullish financial newsletter writers also rose 2.1% to reach 45.7% bullish.
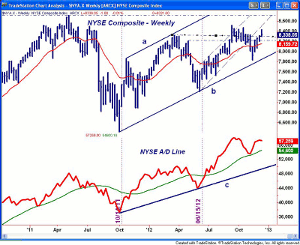
The market internals confirmed the new highs last week, as the daily NYSE Advance/Decline line did move above the October highs. The weekly A./D line has not made new highs and looks ready to close the week flat. It is well above the WMA and the long term uptrend (line c).
A lower close this week will likely cause the A/D line to roll over, suggesting the market will stay in its trading range. The 20-week EMA is at 8,159, which represents first support. It is about 2% below current levels.
Additional support is at 8,074 with the weekly uptrend (line b) now at 7,849, which is very close to the November lows.
NEXT: Stocks and Tom's Outlook
|pagebreak|S&P 500
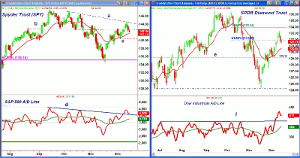
The initial support for the Spyder
Trust (SPY)
at $142.40 is now being tested, with the 20-day EMA at $141.70.
From last Wednesday's high, the 38.2% Fibonacci retracement support is at $140.79, which would typically be a good entry level using Fibonacci analysis. The more important support is at $140.37 (line c) and the November lows.
The S&P 500 A/D line broke through its resistance (line d) last week, which was a positive development. It needs to hold above its WMA on a further correction and then turn higher to reaffirm its uptrend.
The SPY tested its downtrend (line a) early last week, with first resistance now at $143.40, followed by the $144 to $144.55 area.
Dow Industrials
The SPDR Diamond Trust
(DIA)
continued to rally strongly early last week, as it gapped above the 61.8% Fibonacci retracement resistance at $131.90. The rally stalled
at $133.34, which was just below the monthly R2 pivot resistance at $133.68.
The Dow Industrial A/D line was also very strong, moving well above the resistance (line f) that goes back to last July. Its WMA is also in a very solid uptrend, which is a plus.
There is next support for DIA at $130.65 and the rising 20-day EMA. More important support waits at $129.16 (line e), which was the November low. The monthly pivot is at $129.38.
Russell 2000
The iShares Russell 2000
Index (IWM)
closed back above its former uptrend and surpassed the 61.8% Fibonacci
retracement resistance at $82.83 before turning lower. IWM early Friday was
already back to first support in the $82 to $82.40 area.
The next support is at $81.40, with the 38.2% Fibonacci retracement support from last week's highs at $80.85. The monthly pivot support is at $80.39, with the November low at $79.63.
There is resistance now at $82.80 to $83.80.
Nasdaq-100
The PowerShares QQQ Trust (QQQ)
had two failed attempts to break through the resistance at $66.39 before turning
lower. The next support is at $64.44, which is the monthly pivot and the 38.2%
retracement level. The 50% retracement support is at $63.85.
The Nasdaq-100 A/D line (not shown) did break its downtrend from the July highs last week, which is a positive sign. It should now find support at its WMA.
Initial resistance stands at $65.13 and the flat 20-day EMA, with longer-term resistance is in the $68 area.
NEXT: Sector Focus, Commodities, and Tom's Outlook
|pagebreak|Sector Focus
The iShares Dow Jones
Transportation (IYT)
closed sharply higher last week, as it broke its short-term weekly downtrend.
The next resistance is at $94.66 to $95.57, and if it is surpassed that could
resolve the divergence between the two Dow averages that has been a
concern over the past few months.
As of midday Friday, only the Select Sector SPDR Materials (XLB), Select Sector SPDR Consumer Staples (XLP), and Select Sector SPDR Consumer Discretionary (XLY) were higher for the day.
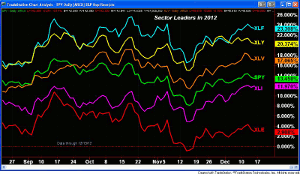
The Performance chart reflects the year-to-date gain of the four sector ETFs that I continue to favor, as I discussed last week in "Best Sector Bets for the New Year." Leading the pack is the Select Sector SPDR Financial (XLF), which is up over 23%, followed by the Select Sector SPDR Consumer Discretionary (XLY) with over a 20% gain.
The Select Sector SPDR Health Care (XLV) is also outperforming the Spyder Trust (SPY) with a 17% gain, versus a 13.4% rise in SPY since the start of the year. The other sector whose weekly relative performance turned positive last week is the Select Sector SPDR Industrials (XLI). It is now up over 11% so far this year, but could overtake the SPY by early in 2013.
Crude Oil
The February crude oil contract is trying to
bottom out in the $85 area. A strong close this week above $91 would be quite
bullish. There is additional resistance in the $95 area.
This could be what the energy sector needs to turn its relative performance or RS analysis positive.
Precious Metals
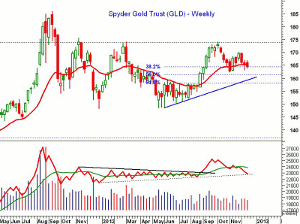
The Spyder Gold Trust
(GLD)
looks ready to close the week lower. This would be the third consecutive lower
weekly close, but so far GLD is holding above the monthly S1 pivot support at
$162.23.
This action is consistent with the deterioration I noted in the OBV analysis several weeks ago in "Two Paths for Precious Metals," when I turned more cautious on the short-term outlook for the metals. My longer-term view is still positive.
The 50% Fibonacci retracement support is at $161.30, which if broken could signal a decline to the weekly uptrend (line a) at $159.20. The 61.8% support is at $158.29.
The Week Ahead
As long as the selling does not become any
heavier Friday afternoon, it looks like a typical shallow correction. This
suggests that the pessimism over the fiscal cliff is not yet that high, and
could mean we will get some resolution of the fiscal cliff issue this week.
If we do get heavier selling, I will still be watching the support at the mid-November lows. A deeper drop should be a good opportunity to buy some of the sector ETFs, as I recommended last week, or some stocks in the strong sectors like the industrials.
I also continue to like many of the overseas markets, both developed and emerging. I am continuing to monitor some of the ETFs that are outperforming the US market. The Chinese ETFs have soared as the data on China's economy continues to improve. They are starting to get a bit overextended, and I may suggest taking some partial profits this week.
If you are not comfortable with individual stocks or only want to invest a smaller amount, the equity income funds I reviewed a few weeks ago deserve consideration. I would spread you investment out over a several-month period in what is known as dollar-cost averaging. Pick a fund or ETF with a low expense rate that does not carry any commission.
- Don't forget to read Tom's latest Trading Lesson, The Most Powerful Pivot Level

