The energy sector certainly has the potential to kickstart the weak markets, but investors will need to watch for a number of key events outlined here by MoneyShow's Tom Aspray.
Stocks moved lower last week, as the rally attempt on Thursday fizzled and stocks closed mixed on Friday.
For some of the averages, it was the worst weekly loss of the past four months. The Spyder Trust (SPY) has declined for three out of the past four weeks, but is still only down 3.4% from the highs.
Many measures of the stock market have relieved their overbought readings from the September 14 highs. On that day, more than 80% of the stocks on the NYSE Composite were above their 50-day moving averages. This was one standard deviation above the mean of 57%.
Now only 57% of the stocks are above their 50-day MAs. A drop below 40% would be slightly oversold, but in June it hit a low of 11%, which was very oversold. In a market uptrend, the current reading is enough to support a new rally phase that could take the market to or above the recent highs.
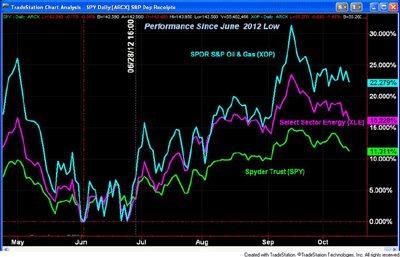
The energy sector has the potential to fuel the next market rally. The performance chart above shows how the SPDR S&P Oil & Gas ETF (XOP), the Select Sector SPDR Energy (XLE), and the Spyder Trust (SPY) have done since the June lows.
On June 28, both XOP and XLE moved decisively above SPY, and have been outperforming the overall market ever since. For example, XOP is up over 22%, while XLE is up 16.3%, compared to a 11.5% gain in the S&P.
The chart shows that both XOP and XLE are well down from the highs on September 14, when they were up 31.3% and 23.5% respectively. As I noted last week, I think they are close to completing their corrections, though one more drop to even stronger support is possible. Both need to move above the prior three-week highs to indicate that their correction is over.
The energy sector has been holding up much better than crude oil prices, which finally broke their losing streak last week. If this sector is going to propel the market higher, then we should see some of the leading oil stocks turn higher in the next week or so.
Clearly, it is still a nervous market. Investors are becoming more concerned about the “fiscal cliff” as we get closer to the end of the year.
The downgrade of Spain’s credit rating to just above junk status led some analysts to conclude that they may be closer to requesting aid. This is what the ECB has been waiting for to start their bond-buying program. The OECD head warned Friday that the ECB’s delay in implementing their bond-buying support was hurting their credibility. Stocks in Europe lost 1.7% for the week, as their rally attempt also failed.
August data from the Eurozone on industrial production supported a slightly more positive outlook for third-quarter GDP. This helped offset the concern over sticking with the tight Eurozone austerity plans, as voiced by the IMF’s Christine Lagarde.
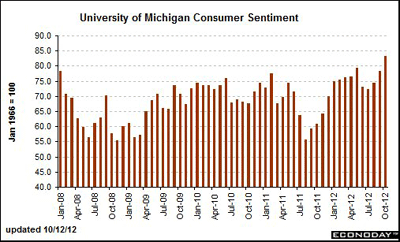
Even the surprising jump in the University of Michigan’s Consumer sentiment couldn’t stabilize stocks, either in Europe or the US. The surge to 83.1 was well above the consensus view of 78.3, and as the chart indicates, this is the highest reading since January 2008. A separate reading on the 12-month economic outlook was up ten points, and both suggested a more optimistic view of future income prospects.
There is a full economic calendar this week, with retail sales, the Empire State Manufacturing Survey, and business inventories out on Monday. Then on Tuesday, we get the Consumer Price Index, which may be interesting, as the Producer Price Index last Friday was higher than expected at 1.1%.
Also out Tuesday are industrial production numbers and the Housing Sentiment Index. The charts on the homebuilding stocks do look overextended, so this report may be quite interesting. This report provides a reading not only on the demand for housing, but also the homebuilders' view of economic momentum, and therefore may impact the markets.
More data from this sector follows on Wednesday with housing starts, and then Friday brings existing home sales. Of course, on Thursday we get the jobless claims, which dropped sharply last week, but the report was discounted due to a lack of quarterly data from one state. On Thursday, we also get the Philadelphia Fed Survey on manufacturing, as well as the Leading Indicators.
NEXT: What to Watch
|pagebreak|What to Watch
The short-term technical outlook deteriorated at the end of the week, as most of the major averages did drop below the late September lows, signaling a short-term downtrend. So far, the decline from the February highs looks like a correction, not a significant top, which makes watching the key support levels quite important.
The sentiment picture turned more negative last week, which from a contrarian’s standpoint is an encouraging sign. The AAII survey reported that just 30.5% are bullish, with 38.3% bearish.
The number of bullish financial newsletter writers dropped slightly to 45.7%, which is down from the 54.2% reading on September 19. A drop back below 40% would be more encouraging, especially if it is accompanied by a pickup in the number of bears, which has been flat around 25%.
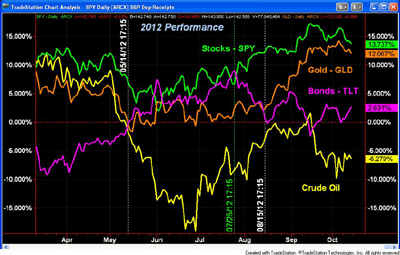
The bond market appears to be getting more nervous about stocks, as the iShares Barclays 20+ Yr Treasury Bond (TLT) did break its downtrend with Friday’s close. As the 2012 performance chart indicates, TLT is back in positive territory for the year, as it bounced after hitting the zero line two weeks ago.
TLT is now up 2.6% for the year, which is still well below SPY at 13.7% and GLD at 12.1%. The chart shows that GLD and SPY have been following the same pattern since the September highs. Crude oil is trying to stabilize, but is still in solidly negative territory.
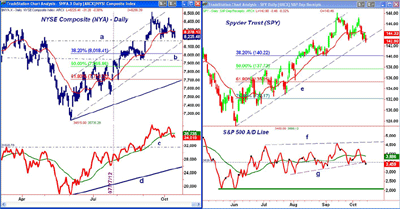
The NYSE Composite closed Friday just above the September 26 lows, with next support at 8,168 and the August highs (line a). The 38.2% Fibonacci retracement support can be a valuable level for determining new entry points, and is currently at 8,018, or about 2.4% below Friday’s close.
There is further support at the August low of 7,940, and the 50% Fibonacci support follows at 7,866.
The NYSE Advance/Decline line confirmed the September highs, but is very close now to the late September lows, as it has dropped back below its WMA. There is next important support at the April highs (line c), with the long-term uptrend at line d.
There is initial resistance at 8,300, and a daily close above 8,400 should signal that the correction is over.
S&P 500
The Spyder Trust (SPY) closed near the week’s lows, as the late September low of $142.95 was broken along with the uptrend (line e). The break of the trend line often does not mark a top, but is more likely a warning that new highs should be watched closely.
The 38.2% Fibonacci support at $140.22 corresponds nicely to the late August low. A drop to this level would be a 5.3% decline from the September high. The 50% support is at $137.73, which would be expected to be the maximum downside for a correction.
The S&P 500 A/D line is still acting weak, as it dropped back below its WMA the previous week and is now testing its support (line g). There is initial resistance at the October highs, with more important at line f.
NEXT: More Stocks and Tom's Outlook
|pagebreak|Dow Industrials
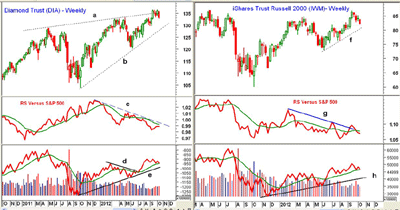
The SPDR Diamond Trust (DIA) was down close to $3 last week, and also dropped below the September low of $133.36. The next good support is at $130.24, which is the 38.2% Fibonacci support level. There is additional support now in the $127.50 to $128 area and the weekly uptrend (line b).
The weekly relative performance or RS analysis has improved over the past few weeks, but is still well below its long-term downtrend (line c). The RS line dropped below its WMA in July, indicating that the Dow was underperforming the S&P 500.
The OBV has been acting stronger than prices, and does show a pattern of higher highs since the October 2011 lows. There is a longer-term divergence, as it is still well below the lows made in early 2011. The OBV is now testing its WMA.
The Dow Industrials A/D line (not shown) has dropped below the late September lows, but is still well above the lows made in late August.
Russell 2000
The iShares Russell 2000 Index (IWM) has declined for the past four weeks, after peaking at $84.18 in the middle of last month. There is next strong support in the $80 to $81 area and the uptrend (line f).
A decisive close below $80 would suggest that the strength in early September was not a change in trend for the small caps. The next good support is in the $78 area.
The relative performance broke through its downtrend and WMA in early September before reversing. In now needs to move back above its WMA to indicate that a bottom is really forming.
The weekly on-balance volume (OBV) is still holding above its WMA and good support from earlier in the year. The Russell 2000 A/D line (not shown) has also reversed and dropped below the late September lows last week, but is still well above its uptrend from the June lows.
Good resistance for IWM waits in the $83.50 to $84 area.
Nasdaq-100
The PowerShares QQQ Trust (QQQ) did manage to close higher Friday, after getting hit hard early in the week. It has dropped over 5% from the highs made last week.
The 38.2% support from the June lows at $66.51 has not been reached, with the 50% support next at $65.27.
The Nasdaq-100 A/D line (not shown) has made lower lows, but is still above the support from July. There is first chart resistance now at $67.50, with stronger in the $68.50 to $69 area.
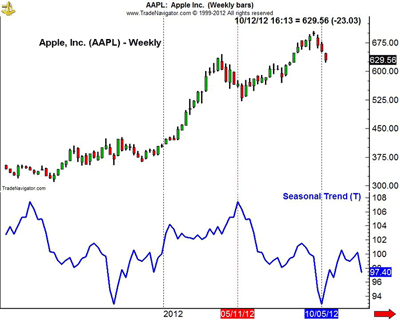
As I discussed Friday, the decline in Apple (AAPL) has accounted for most of the decline in QQQ. The seasonal chart I referred to in the article shows that it typically bottoms on October 5 and forms a major seasonal high on May 11. The stock stabilized Friday, and as I noted in the article, I am looking to buy at lower levels.
NEXT: Sector Focus, Commodities, and Tom's Outlook
|pagebreak|Sector Focus
The iShares Dow Jones Transportation (IYT) was about flat last week, with all of the other sectors showing losses.
Select Sector SPDR Technology (XLK) and Select Sector SPDR Consumer Staples (XLY) performed the worst, down about 3% and 2.7% respectively. The Select Sector SPDR Industrials (XLI), Select Sector SPDR Health Care (XLV), and Select Sector SPDR Materials (XLB) were all down close to 2%.
The better than expected earnings did not help JPMorgan Chase (JPM), as it was down over 1%, while Wells Fargo (WFC) was down over 3% after missing revenue estimates. The Select Sector SPDR Financials (XLF) was down 1.4% as a result.
Crude Oil
The December crude-oil contract was higher last week, though it gave up some of its gains on Friday. It needs to close above the $94 level to indicate that it has bottomed out. The key 61.8% support at $87.40 still needs to be watched closely.
Precious Metals
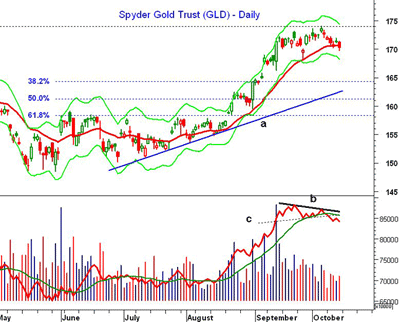
The SPDR Gold Trust (GLD) closed over $2 lower last week. It and has next important support in the $167 to $168 area.
The short-term negative divergence in the OBV (line b) was confirmed by the drop below support (line c). This is consistent with a further correction, but not a top, as the weekly and monthly OBV remain strong.
The daily chart shows that the 38.2% Fibonacci support is just above $164, with the daily uptrend (line a) at $162.25.
GLD now needs to close back above the $172 level to stabilize the short-term outlook.
The Week Ahead
Another Friday with a mixed close...which may reflect an indecisive outlook going into next week’s debate. Many funds close their book at the end of October, so if they need to do new buying, they should be starting by the end of next week.
Still, the major averages need several consecutive higher closes with good market internals to indicate that the correction is over. I still view this as a correction, and think it is an opportunity to buy some of the diversified sector ETFs as they test good support. This allows the risk to be better controlled, and they are less volatile than individual stocks.
Of course, I will need to get confirmation that the correction is over before becoming a more aggressive buyer. Be sure to have your stops in place and your buy orders in the market, as if I am correct, the test of stronger support may be brief.
- To look at the current Charts in Play Portfolio, click here.
- And don't forget to read Tom's latest Trading Lesson, October's Top Seasonal Sectors.

