The market’s strength this week surprised many investors, and certain sectors have still more potential, writes MoneyShow senior editor Tom Aspray. But those who are very long on stocks should maintain their defensive stance right now.
On November 17, my weekly column was headlined “Don’t Bet Against the Stock Market.” It was written after stocks had corrected from the October highs, and many were suggesting that the October rally was just a “bull trap.”
At the time, the Spyder Trust (SPY) was at $121.97 and the Dow Industrials stood at 11,796. Both dropped another 4% to 5% before bottoming just after Thanksgiving. Now SPY is over 15% higher.
So why would I still bet on the stock market?
Make no mistake, the risk in the major averages is obviously much higher now than it was then. And as you probably know by now, I feel managing risk is the key to successful investing. This means not only managing the risk on each position, but also on the entire portfolio.
At current levels, I would recommend that one have at least 20% to 30% in cash, and that new positions be purchased using the proceeds from the sale of existing positions. The Charts in Play portfolio now has 15% to 20% more in cash than it did just a month ago.
There are quite a few stocks that appear to have the potential to gain another 20% to 30%, but the risk in buying them at current levels is too high. There are still some that have good upside potential, and where the risk can be well controlled.
What about those who are either underinvested or not invested in stocks at all? I would start off small, with no more than 2% to 3% in any one position. Many make the mistake of taking a much too large position in any one stock when they are trying to catch up. The odds of this working out are not good.
Those large-cap stocks with good dividends should hold up best when the market does correct. Most importantly, have stops in place for each position.
- For more on building a strong stock portfolio, read my recent Trading Lesson.
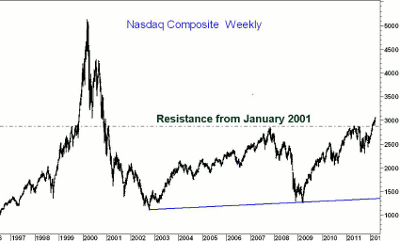
In my opinion, stocks have the best chance to generate total returns significantly better than the rate of inflation…but that does not mean buy and hold. The long-term outlook for stocks also improved when the Nasdaq Composite was able to overcome the resistance at 2,892 that goes back to 2001.
Anyone who bought the Nasdaq Composite in the past 11 years is now holding a profit, as prices had failed to move through this level in 2007. Pullbacks to this support zone in the coming months are likely to be well supported.
Back in November, I also commented that “if we see a shift from bonds to stocks, the rally could get exciting.” Finally, this shift appears to be occurring. Last week, I noted that the yields on the 30-year T-bond appeared to have bottomed.
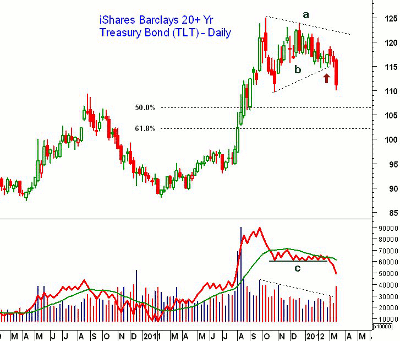
Rates rose significantly last week, and the daily chart of the iShares Barclays 20 Year Bond ETF (TLT) shows that it closed sharply lower last week. As yields rise, prices fall, and the 50% Fibonacci support is at $106.50, with the 61.8% support at $102.20.
Volume increased on the break of support (line b), and the on-balance volume (OBV) is negative as it has dropped below the October lows.
As bondholders start to see the value of their bonds drop, it will be harder and harder to justify holding them for a 2% yield when the bonds have dropped 5% in value. Stocks are likely to benefit from this new influx of cash.
|pagebreak|
While Greek debt problems seem to be solved for the time being, concerns are growing over Spain, whose level of debt rose to 68.5% of GDP in the fourth quarter of 2011. While this level is below 87.4%, the average of Eurozone countries, its rate of increase has some concerned.
Meanwhile, German Chancellor Angela Merkel urged other European leaders to resolve the ongoing debate over the two bailout funds that it is hoped would prevent a financial contagion from spreading. Warnings from Fitch that the United Kingdom could lose its AAA rating had little impact on its stock market, as the FTSE-100 closed at new rally highs.
Nothing on the economic front is likely to scare stock investors this week, and the main threat remains a worsening of the conflict with Iran. This week, we have the Housing Market Index on Monday, followed by housing starts on Tuesday and existing home sales onWednesday.
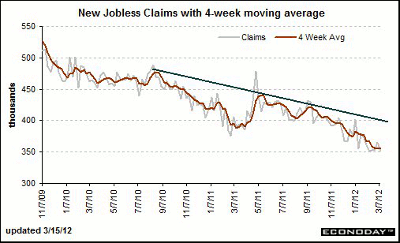
Jobless claims declined again last week, and the chart shows a well-defined downtrend is in place. A further decline is expected this coming Thursday, but I would not be surprised to see an uptick sometime in the next few weeks, before the decline resumes.
Finally, on Friday, we get the February numbers on new home sales.
WHAT TO WATCH
Stocks were impressive last week, as the S&P 500 closed above the 1,400 level, and the Spyder Trust (SPY) closed up over 2.7% for the week. This was better than the 1.5% gain in the Powershares QQQ Trust (QQQ), despite another strong performance by Apple (AAPL).
The rally seemed to stall a bit Friday, after the Reuters/University of Michigan consumer sentiment report was weaker than expected. Market sentiment also became less bullish last week, with the number of bullish financial newsletter writers dropping to 43.6%—down from a high of 54.8% just five weeks ago.
The number of bulls in the AAII rose a bit, to 45.6%, from 42.3% the prior week. Both levels are still well below what is normally seen at significant market tops.
The favorable results of the so-called "stress tests" gave banks a boost last week, and the relative performance, or RS analysis, has turned positive on the Select Sector SPDR Financial (XLF) for the first time in several years. A pullback in this sector is likely in the next week or two, and this should present a buying opportunity.
The Advance/Decline line on the NYSE Composite did make a new high last week, which is a positive for the intermediate term. Prices are overextended on a short-term basis, so we may see the market consolidate this week.
NEXT: S&P, Dow, and Tom’s Outlook
|pagebreak|
S&P 500
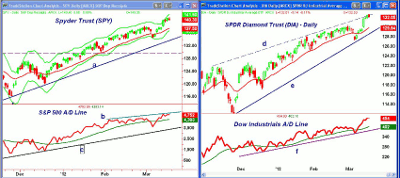
The Spyder Trust (SPY) finally overcame the resistance at $138.26, which was the 78.6% Fibonacci retracement resistance, and also surpassed the Fibonacci equality target (100%) from the October rally.
There is chart resistance next in the $141.50 to $142 area, with the next major Fibonacci projection target at $145.27.
SPY is now testing its daily Starc+ band, so some sideways price action would not be surprising. The weekly Starc+ band for this week is at $145.97.
There is initial support now at $137.50 to $138.50, and then stronger levels at $136. (The 20-day EMA is at $137.51.) The recent low at $134.26 is now the key level of support to watch.
The S&P 500 A/D line made new highs last week, but is not rising as sharply as it was earlier in the year. It is well above its WMA and the recent lows. The major support for the A/D line is at line d.
Dow Industrials
The SPDR Diamonds Trust (DIA) matched the performance in the SPY last week and hit the next major target in the $132.50 area. The upper trend line resistance (line d) has been reached, which may cause prices to consolidate.
The next major resistance, from 2007, is in the $133.70 to $137 area.
There is first support now in the $130 area and the 20-day EMA, with stronger levels around $127 to $128.50. It would take a break below $127.18 to signal a deeper correction is underway.
The Dow Industrials A/D has moved well above the previous highs and once again is acting strong. This suggests that possible the correction in the large cap stocks is over.
NEXT: Nasdaq, Small Caps, and Tom’s Outlook
|pagebreak|
Nasdaq-100
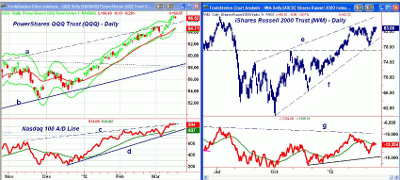
The PowerShares QQQ Trust (QQQ) surpassed the resistance from 2001 at $65.61, and the week’s high at $66.82 is quite close to the Fibonacci price target of $67.15.
The Nasdaq-100 Advance/Decline (A/D) line also made new highs last week (line c). There is initial support now at its rising WMA and the uptrend (line d).
There is first good support at $65.50, with the 20-day EMA at $64.71. The majority of stops are now likely under the recent low of $63.23.
Russell 2000
The iShares Russell 2000 Index Fund (IWM) has rallied impressively from its uptrend (line f) and the support in the $78.40 area. IWM is now challenging the prior highs at $83.31, with the upper trend line at $85.60 (line e)
The daily chart shows a potential rising wedge formation (lines e and f) that is potentially negative. It will need to be watched closely.
The Russell 2000 A/D line is just barely above its flat WMA and is lagging the price action. The A/D line still shows a longer-term divergence, as it is well below the resistance at line g.
NEXT: Sector Focus, Commodities, and Tom’s Outlook
|pagebreak|
Sector Focus
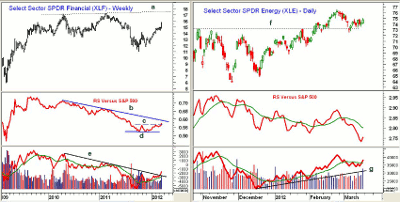
Last week’s action in the Select Sector SPDR Financial (XLE) appears to have been quite significant. It closed near the week’s highs, with the next resistance at $16 to $16.50, and then major resistance (line a) in the $17.50 area.
XLE had a high in 2007 of $38.15, so the major 38.2% Fibonacci retracement resistance is at $18, with the 50% level at $22. This is not an unreasonable target over the coming months.
The RS line has finally moved above the key resistance (line c), which completes the bottom formation. A move through the downtrend (line b) will confirm. The OBV has broken its downtrend (line e), as volume increased nicely last week.
There first good support sits in the $14.70 to $15.20 area.
The Select Sector SPDR Energy (XLE) was recommended earlier in the week, and it closed strong on Friday. This suggests that the test of the support (line f) was successful. The next resistance stands at $75 to $75.70, with initial upside targets at $77.58.
The daily RS analysis is still negative, as it is well below its declining WMA. The daily OBV, however, is positive, as it has moved above its WMA. The weekly OBV (not shown) also looks strong.
Crude Oil
Crude oil, basis the May contract, appears to have held the support in the $104.50 to $105 area, closing at $107.74 last Friday. The recent pullback corresponded to a retest of the breakout level of the flag formation.
A close above $109 should confirm a resumption of crude’s uptrend, with the next resistance in the $110 to $111 range. The next major upside targets from the flag formation are in the $115 to $116 area.
Precious Metals
The SPDR Gold Trust (GLD) had another rough week, losing well over $5. The next week or two could take it back to more important support. As I noted last week, the gold miners look much worse technically, and should be avoided.
GLD violated the minor 50% support level at $161.07, with the important 61.8% support next at $158. The long-term support starts in the $148 to $152 region.
The iShares Silver Trust (SLV) closed below the key support at $31.80 last week, which reasserts the downtrend. The next good support in the $30 area, and I would not be surprised to see a drop to around $28 on panic liquidation.
The Week Ahead
The strong performance last week came as a surprise to even the late bulls. The energy sector could play a pivotal role in supporting the overall market, but early strength this week will be important. The material sector is also trying to bottom out, which would be a plus.
My recommended buying levels for several stocks were hit last week, including some in the energy sector as well as the utilities. I will be looking for more opportunities in the energy sector this week, as well as targeting some favorable buy levels in the financial sector.
I would caution those who are very long stocks not to get greedy at these euphoric levels. If you have a 20% or greater profit in any position, you should consider taking some profits on at least part of that position.
I will likely recommend taking more profits next week, and will continue to raise the stops on existing positions.
- In this week’s Trading Lesson, "Building a Strong Stock Portfolio," I go into more detail on the processes I use to make my recommendations and manage my stock positions. An update on the portfolio as of last Thursday’s close can be found here.
You can also find all of Tom’s market comments by bookmarking his columnist page

