Bullish magazine headlines have been the death of many a rising market, and in fact a correction is expected, says MoneyShow senior editor Tom Aspray, who points out a few sectors that look technically strong for new buying in the near future.
I don’t know how many of you saw last week’s cover of Barron’s and its headline, “Dow 15,000”, but it certainly got my attention.
Sensational headlines like this can sometimes reveal extremes in market sentiment and easily lead casual investors astray—anyone who doesn’t read Barron’s on a regular basis, for example, may have gotten the wrong idea. (As I have noted previously, I do find Barron’s to be a valuable resource, and it should be read by all serious investors.)
Similarly, those who felt compelled to buy Apple (AAPL) last week, when it moved above $500, have had a wild ride.

Many have written about magazine covers that have coincided with tops or bottoms in the stock market, as well as in individual stocks.These kinds of covers and headlines have a tendency to predict action contrary to the headline (such as the “buy buy buy” phenomenon in the late 1920’s), and as such necessitate careful attention. This has resulted in the creation of the Magazine Cover Indicator.
Therefore, it was really no surprise that this headline has gotten lots of press in the last week, with such diverse characters as Jim Cramer and Blackrock’s Bob Doll weighing in on the topic.
In the article, noted finance professor Jeremy Siegel of the Wharton School of Business makes the case, based on current valuations, for a move in the Dow Industrials to 15,000 in the next two years.
It should come as no surprise to my readers that I don’t put much faith in such specific predictions based on the broad theoretical approach economists bring to the table. I have found that the conclusions using technical analysis are much more reliable.
Given the recent jump in bullish sentiment by the financial newsletter writers, I do pay attention to magazine covers when they come after either extended rallies or declines. The Barron’s headline was not the sort of headline that you saw last summer or early fall when stocks were near their lows, and buying opportunities were at their best. Rather, the following cover might look a bit more familiar:

The above cover came out on June 20, 2011, as the cover article discussed “The 5 Myths of the American Recovery” which might have kept you out of the stock market for the rest of the year if you believed the negative outlook for the US economy.
Though stocks closed higher for the week this week, and while there are no confirmed signs of a short-term top, there are signs of deterioration. Market internals gave warning signals last Thursday.
I do not think that the release of this cover will coincide with an important market top; however, it does support a cautious investment stance for now. As I discuss in more detail in the What to Watch section, there are some industry groups that appear to be bottoming, and others that will look more attractive after a decent correction.
The US market for the most part ignored the negative news from the Eurozone. The apparent deal gave stocks a boost last Tuesday, but problems with the agreement surfaced Wednesday and that pressured stocks.
Adding to the Euro gloom was Moody’s downgrade of the debt of Spain, Portugal, and Italy, while changing their outlook to negative on the United Kingdom, France, and Austria. There were further warnings from Moody’s on Thursday that they could make severe cuts to the ratings of the big banks, but stocks ignored this to close higher.
Overall, US economic data helped encourage investors. Even though retail sales data was weaker than expected, the Empire State and Philadelphia Fed reports reflected a growing manufacturing sector. The icing on the cake was a sharp drop in jobless claims, as they reached the lowest level in two and a half years.
With the US markets closed Monday, Tuesday brings the S&P Case-Shiller Housing price index, consumer confidence, and the Richmond Fed Manufacturing Index. We get more housing data Wednesday with existing home sales, and then new home sales data on Thursday.
Also out Thursday, we get durable goods orders and another reading on jobless claims. Friday brings the preliminary reading on fourth-quarter GDP and the Reuters/University of Michigan consumer sentiment for February. The latter jumped sharply in January, and further gains are expected.
NEXT: What to Watch
WHAT TO WATCH
As we approach the end of February, we enter a period historically weak for stock prices. After last Wednesday’s action, the market internals and price action in Apple (AAPL) suggested that the market was completing a short-term top.
Thursday’s strong performance reversed some of the deterioration I had been noting, but there still appears to be a loss of upside momentum.
While it is certainly possible that we will see another 1% to 3% gain in the S&P 500 before a short-term top is complete, I feel there is a greater risk in the coming weeks of being too fully invested. Therefore, I took some profits and tightened stops on positions recommended in my Charts in Play column. For the time being, I will update the model portfolio weekly.
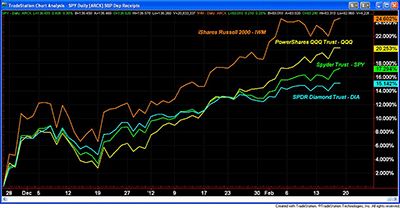
This chart shows the performance since the Black Friday low (November 25) of four major ETFs that track different segments of the stock market. The wide range in performance further illustrates the importance of sector selection in the current environment.
The small-cap iShares Russell 2000 Index Fund (IWM) has outperformed the big-cap SPDR Diamonds Trust (DIA) by over 9% during the period. The small caps were the focus of my column on November 25.
The second best performer was the tech-heavy PowerShares QQQ Trust (QQQ) which was up well over 20%.
Once a short term top has completed, the small-cap and tech sectors are likely to be my favorites, along with the energy sector, where the weekly analysis has turned positive.
S&P 500
The Spyder Trust (SPY) made new closing weekly highs last week. It is not far below the next major hurdle, which is the 2011 high of $137.18.
There is converging resistance now at $138.26, which is the 78.6% Fibonacci retracement resistance (link), as well as the Fibonacci equality target (100%) from the October rally.
As noted last week, the S&P 500 Advance/Decline line broke its short-term uptrend last week, which may be an early warning sign. The recent new highs have not been accompanied by a significant new high in the A/D line.
There is initial support now between $133.60 and $134.40 and then the rising 20-day EMA. A close below $133 is likely to signal a drop to more important support in the $130 area.
There is additional chart support in the $127 to $128 area, with the 200-day moving average (MA) at $125.92.The major 38.2% support now sits at $125.48.
The intermediate-term analysis is clearly positive, so any correction should be followed by further new highs.
Dow Industrials
The SPDR Diamonds Trust (DIA) has been lagging since the latter part of December, and the Dow Industrials A/D line has still not confirmed the recent highs.
This short-term divergence is consistent with a near-term top, not a change to the major trend. The first good support at $127 and the 20-day EMA.
There is additional chart support in the $125 area, with the November highs at $122.80. A drop to this level would mean a further decline of 3.9%. Then, beyond that, the 38.2% Fibonacci support is at $119.46 and the 50% retracement support follows at $116.48.
NEXT: Nasdaq, Sector Focus, and Tom’s Outlook
Nasdaq-100
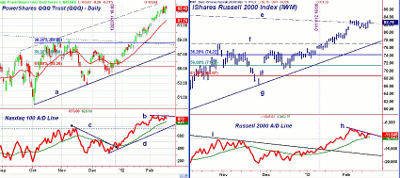
Despite the impressive gains last Thursday, the PowerShares QQQ Trust (QQQ) did not exceed last Wednesday’s high. There is first support at $62.63, with stronger levels at $60.60 to $61.40.
The late-October high was $59.20, and then the 38.2% Fibonacci retracement support level from the October lows follows at $58.60. The more important 50% support is at $56.98 along with the daily uptrend (line a).
The Nasdaq-100 Advance/Decline (A/D) line peaked on February 3, and has since formed lower highs (line b). The negative divergence is consistent with a short-term top. The A/D line is still above its rising weighted moving average (WMA), but could decline to converging support (lines c and d).
Once above the recent high at $63.86, there is resistance from 2001 at $65.61. There is also a Fibonacci price target of $67.15.
Russell 2000
The iShares Russell 2000 Index Fund (IWM) barely surpassed the February high of $83.22 last Friday. The July 2011 high was $84.30. The long-term downtrend (line e) seems to be limiting the upside.
IWM has essentially been moving sideways over the past two weeks, which may be all the correction this sector will see. The Russell 2000 A/D line has been diverging since the early February highs (line h). A drop back below last Wednesday’s lows will signal a deeper correction.
There is initial support now at $80.80 to $81, with the first strong support in the $77 area (line f). The 38.2% Fibonacci support from the October lows is at $74.28, with the 50% support at $71.15.
Sector Focus
The iShares Dow Jones Transportation ETF (IYT) broke its uptrend on February 10 and has since declined to the first good support in the $92 area. More important support from the October and December highs sits at $90.80.
The Select Sector SPDR Technology (XLK), Select Sector SPDR Energy (XLE), Select Sector SPDR Consumer Discretionary (XLY) and Select Sector SPDR Consumer Staples (XLP) all made convincing new highs last week.
With last week’s action in Apple (AAPL) and the plunge in Gilead Sciences (GILD), also a member of the Nasdaq-100, the technology/biotech groups look the most overextended at present.
NEXT: Energy, Commodities, and Tom’s Outlook
Sector Focus (continued)
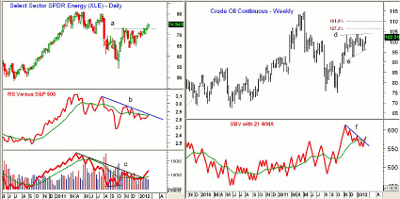
The Select Sector SPDR Energy (XLE) looks the most interesting. I have been looking a pullback to the $70 area, but this looks less likely with the strong close above last October’s highs (line a).
The relative performance, or RS Analysis, has moved back above its WMA, and is close to breaking its downtrend (line b).
The weekly on-balance-volume (OBV) has moved sharply higher, well above its WMA and the downtrend (line c). As noted last fall, it did form a positive divergence at the October lows.
The next resistance for XLE stands at $76.
Oil
Crude oil was strong last week, with the April contract closing over $4 a barrel higher. The weekly chart appears to show a flag formation (lines d and e), which is a likely to be completed in the next few weeks.
The 127.2% Fibonacci retracement target is at $106.40, and then the 161.8% follows at $110.
The OBV has moved back above its WMA, and has broken its downtrend, which is positive for the intermediate term. As discussed late last year, crude oil normally bottoms in February, which coincides nicely with the positive technical readings.
- Also read: The 4 Key Seasonal Trends for 2012
Precious Metals
The SPDR Gold Trust (GLD) peaked at the start of February, and has been in a correcting gradually. In terms of price, the decline has been mild.
I have been looking for a deeper correction to buy. As I discussed last week, “The Golden Opportunity Is Still Ahead.”
However, if we do not see lower prices in the next week—or GLD closes above $170.40—I will become a more aggressive buyer. The daily OBV (not shown) is still negative, which does allow for a further correction.
The completion of the flag formation has initial upside targets in the $196 area, so the potential reward on the upside is significant.
The iShares Silver Trust (SLV) has traded in a fairly narrow range over the past three weeks. A close above $33.50 would be a positive sign. There is next strong resistance in the $36 area. On the other hand, a close below $30.60 would be negative.
The Week Ahead
So far, the market has continued to edge higher, and it is hard to determine whether all of those who had been looking to buy a correction have given up and jumped into the market. The market still looks vulnerable to a correction, though it may just be a sharp news-related drop.
The markets are a bit nervous going into Monday’s holiday, as that is also when the next steps are expected concerning Greece’s debt problem. I still recommend having a plan in place for each of your holdings, and suggest taking some profits when the market is moving higher.
Last week, there were several bullish developments in some of the energy stocks, and they should hold up better even if the market finally does correct. This is where I will be looking to do new buying in the next week or two.
There are also some lagging industry groups like the asset management stocks, which may take over leadership in the coming months.
Don’t miss Tom’s latest Trading Lesson, Don’t Fall into This Volume Trap


