The annual fire sale of small-cap stocks may be happening several weeks early, which could give savvy investors a ground-floor entry point. But where to invest? MoneyShow.com senior editor Tom Aspray shares his recommendations.
The action early in the week leading up to Thanksgiving may have damped investors’ enthusiasm for stocks, but I continue to expect that consumers will be spending more than most expect. This would allow for stocks to rally before the end of the year.
Since 1925, market data indicates that small-cap stocks outperform the broader stock market in January. This phenomenon was first identified by Sydney B. Wachtel in his 1942 paper, “Certain Observations on Seasonal Movements in Stock Prices.”
The prevailing explanation for this so-called “January Effect” is that investors dump their small-cap losers before the end of the year to book their losses, and this pushes many of theses stocks to bargain levels. This, in turn, sets the stage for a sharp oversold rally into January.
Like many of the seasonal patterns now more broadly recognized by investors, the turn often comes a bit early. The current decline and increase in bearish sentiment with the supercommittee failure suggests that investors may be dumping their stocks now.
Also, for the first time since September, the double-dip forecasts are again hitting the financial airwaves. Though they may eventually be correct, recessionary forecasts ahead of the fact are rarely right.
There are several ways to invest in small-cap stocks, including some very liquid small-cap ETFs, a closed-end small-cap fund, or through individual small-cap stocks, where the risk (as well as the potential reward) is much higher.
The Russell 2000 is one of the broadest readings of the small cap market and has a median market capitalization of $473 million. It currently has a price-to-earnings ratio (P/E) of 16.92, with a dividend yield of 1.44%. The largest stock in the index has a capitalization of $3.65 billion.
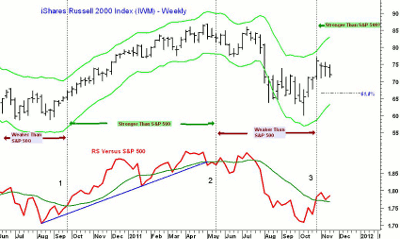
The weekly chart of the iShares Russell 2000 Index (IWM) is shown here, along with the relative performance, or RS analysis. This measures the performance of IWM versus the S&P 500 to identify periods when the small caps are outperforming or underperforming the S&P 500.
In September 2010 (line 1) the RS line moved above its weekly moving average (WMA) and began a new uptrend, signaling that it had started to outperform the S&P 500. The RS stayed positive until the week of May 25, when the RS lines formed lower lows (line 2).
During this period, IWM was up 26.6% compared to a 5.3% decline in the Spyder Trust (SPY). Therefore, the small-cap IWM outperformed the large-cap S&P 500 by 31.9% during the eight-month period—almost 4% per month.
From May until the first week in November, the RS analysis favored the SPY (or S&P 500), and during this period it was up 5.6% while the IWM lost 9.6%. This is a difference of 15.2% over a five-month period.
This week, IWM has declined to test initial support in the $69 to $70 area. The 50% Fibonacci retracement support is at $68.54, with the 61.8% level at $66.54. The weekly Starc- band is at $63.40.
If the IWM can move above the October high at $77, the first upside target is at $80, with additional upside targets in the $82 to $83 area.
NEXT: An Interesting Competitor ETF
|pagebreak|An alternative to the IWM is the S&P SmallCap 600, which is a cap-weighted average. The ten largest holdings make up just over 6% of the average. The ETF that tracks this average is the iShares S&P SmallCap 600 Growth (IJT), which trades around 200,000 shares a day—contrast that with the 80 million IWM shares traded daily.
With only 600 stocks, as opposed to 2,000 for the IWM, one might expect that it would be a bit more conservative and have lower returns. In actuality, during the past 15 years, the S&P SmallCap 600 has outperformed the Russell 2000 in 11 of the 15 years. S&P attributes much of this superior performance to how well the S&P 600 does in January.
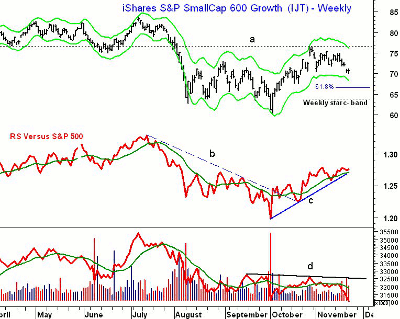
The daily chart of the iShares S&P SmallCap 600 Growth (IJT) shows that it has corrected from the October 27 high of $76.41.
As of Tuesday, November 22, it is testing the 38.2% Fibonacci retracement support at $70.24. The 50% Fibonacci retracement support is at $68.33 with the key 61.8% support level at $66.43. The weekly Starc- band is at $63.80.
The downtrend in the daily RS (line b) was broken in early October, and then was retested in early November. The RS line is still holding its steep uptrend (line c) and is above its WMA. A break of this support would not be enough to suggest that the small caps had started to underperform the S&P 500.
The daily on-balance volume (OBV) is very close to its October lows, and is acting weaker than prices. The volume has picked up over the past few days, although the OBV needs to move back above the resistance (line d) to complete a bottom formation.
A daily close in IJT above $75.52 would be positive, and a move above the October highs should signal a rally to the $80 to $81.50 area.
NEXT: A Fund Alternative and a Stock to Watch
|pagebreak|Another way to invest in small-cap stocks is through a closed-end fund like Royce Value Trust Inc. (RVT). It invests in value-oriented stocks of small-cap and micro-cap companies across a broad spectrum of sectors. It is currently trading at a more than 13% discount to its net asset value (NAV).
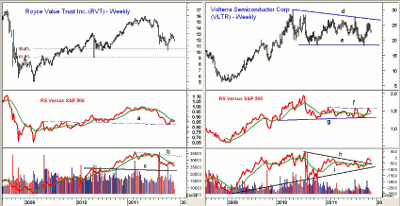
RVT has a current yield of 6.9%, and trades about 200,000 shares per day. The fund hit a high in early May of $15.87, and is now down 24.8% from that level. It reached a low of $10.15 in early October, but the recent rally failed below the September high of $13.19. This is the key level to watch.
The 50% Fibonacci retracement support level was violated in October, with the 61.8% support at $9.20. The RS analysis topped in June, and the RS line is still below its WMA, which is trying to flatten out. The good support in the RS from 2009 was recently tested.
The weekly OBV did form a divergence at the April highs (line b), and is still below its WMA. There is strong OBV support (line c), but the OBV needs a strong move back above its WMA to signal that a low is in place.
Once November is over, I will be running further scans to look for small-cap stocks that look attractive, but Volterra Semiconductor Corporation (VLTR) is a $550 million dollar semiconductor company that looks quite interesting technically at the moment.
Since early 2010, VLTR has traced out a broad flag formation (lines d and e) which appears to be a continuation pattern. If this is the case, the next major move should be to the upside, with weekly targets in the $34 to $36 area.
It is trading lower this week, with next support sitting in the $21.50 to $22 area and major levels in the $18 to $19.60 area (line e). The weekly RS line is locked in a trading range, but has held key support (line g) on several attempts. The RS is above its WMA, and a move through resistance (line f) would be a very bullish sign.
The weekly OBV has broken its downtrend (line h), and is holding well above its rising WMA. This is a positive sign, with stronger OBV support (line i). The daily OBV (not shown) did form a positive divergence at the lows, but has just dropped below its WMA.
How To Profit: As of the close on Tuesday, November 22, the short-term momentum for the stock market is negative, yet the market internals have not yet confirmed a top formation.
For the iShares Russell 2000 Index (IWM), go 50% long at $68.72 and 50% at $66.88, with a stop at $62.80 (risk of approx. 7.4%).
For the iShares S&P SmallCap 600 Growth (IJT), go 50% long at $68.64 and 50% at $66.62, with a stop at $63.86 (risk of approx. 5.6%).
For the Royce Value Trust Inc. (RVT), go 50% long at $11.62 and 50% at $11.30, with a stop at $10.37 (risk of approx. 9.5%).
For Volterra Semiconductor Corporation (VLTR), go 50% long at $21.64 and 50% at $19.54, with a stop at $18.76 (risk of approx. 8.9%).
- Tom’s regular Week Ahead column will resume on December 2. In the meantime, don’t miss his latest Trading Lesson, No Need to Pick Bottoms or Tops.


