It could be a couple of weeks until we know the true effect of the latest US debt debate in the markets, but there are still no clear signs that a year-end rally has been written off, writes MoneyShow.com senior editor Tom Aspray.
Stocks had a pretty rough week. Fitch’s warning about the risks that US lenders could face if the Euro debt contagion spreads shocked the markets before the close on Wednesday. The selling continued on Thursday, but stocks traded in a narrow range on Friday and the close was mixed.
The financial sector came under further pressure after the report, as the Select Sector SPDR Financial (XLF) finished the week 9% lower. As I discussed in “Stick with ’Green Light’ Sectors”, the weekly relative performance, or RS analysis continues to suggest that this sector is underperforming the S&P 500.
This will make the pre-Thanksgiving trading more important, because the major market averages are approaching more important technical support.
The focus last week was once again on the Euro debt crisis, but yields on the widely watched Italian and Spanish bonds eased Friday on further purchases by the European Central Bank (ECB). It is becoming increasingly clear that the ECB is playing a key role, though. By the end of the week, the Euro tensions seemed to lessen.
This week, the supercommittee deadline will hang over the markets, but it is unclear how traders will react if no agreement is reached. With the expectations so low, it is possible that the reaction will not be so negative even if the two sides remain deadlocked.
This will make the action early in the week important. If the markets decline into Wednesday, a sharp drop becomes less likely. If, on the other hand, stocks do rebound, it will be the strength of the rebound that may give us some clues as to how it might withstand a failure by the supercommittee.
Most of last week’s economic reports were better than expected. Inflation eased in October, consumer confidence hit a five-month high, and jobless claims fell to a seven-month low. Retail sales and the Leading Economic Indicators (LEI) beat estimates, with the LEI jumping to 0.9% from 0.2% the prior month. These are all encouraging for the pre-Christmas buying binge that gets started on Friday.
For a holiday-shortened week, there are still plenty of economic reports. Existing home sales figures are out on Monday, followed by the preliminary reading on third-quarter GDP on Tuesday, along with the FOMC meetings.
On Wednesday, we get durable-goods orders, personal income and outlays, jobless claims, and the University of Michigan Consumer Survey. The markets, of course, are closed on Thanksgiving, and will close early on Friday.
NEXT: What to Watch
|pagebreak|WHAT TO WATCH
The market’s decline in the last three days of the week took the major averages back to key support. The sentiment picture is much different now that it was in late September and early October, but has not yet reached bullish extremes.
The number of bulls in the AAII survey declined last week to 41.9%, from 44.7% the previous week. Typically readings well above 50 are associated with market peaks. The Investors Intelligence Survey of newsletter writers saw an increase in the bulls to 47.4% from 44.2%, while the bears fell to 32.6% from 34.7% the prior week.
The market internals were lower last week, but as I will discuss below, they do not yet look consistent with a top formation. If the A/D lines drop below the early November lows and then rally to form lower peaks, it will weaken the short-term outlook.
The Dow Industrials continues to be the strongest market sector, as it closed higher Friday, unlike the S&P 500 or Nasdaq. This is further proof that the large-cap, dividend-paying stocks are still favored.
S&P 500
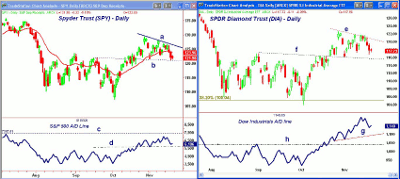
The Spyder Trust (SPY) closed last Wednesday below its 20-day EMA, and declined to test support that goes back to September in the $121.90 area (line b). The 38.2% Fibonacci retracement support stands at $121.03.
If this level is broken on a closing basis, the next support sits at $119.20, and the 50% retracement support follows at $118.43. A break of this level will clearly weaken the short-term outlook.
The S&P 500 A/D line turned up slightly on Friday, and so far is holding well above the November lows (line d). A strong move above the summer’s highs (line c) will indicate upward acceleration.
There is initial resistance now at $124, with the daily downtrend now at $126.60.
Dow Industrials
The Spyder Diamonds Trust (DIA) failed at the upper boundary of its flag formation (line e) before turning lower. The pullback last week had a low of $116.79, holding above the November 1 lows of $116.03.
The 38.2% support level is at $115.48. The more important 50% retracement support stands at $113.21.
There is initial resistance now for DIA at $119.75, and a close above $121.75 would be very positive. Once above this level, the next targets would be the late October highs at $122.58, and then the longer-term downtrend in the $123.56 area.
The Dow Industrials A/D line is still leading the other major A/D lines, as it only had a minor setback last week. It shows a clear pattern of higher highs and higher lows. If the overall market is going to break out to the upside, the Dow’s A/D line could break out first.
NEXT: Nasdaq, Sector Focus, and Tom’s Outlook
|pagebreak|Nasdaq-100
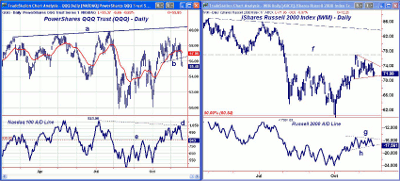
The PowerShares QQQ Trust (QQQ) was hit the hardest last week, as several of the biggest names—including Apple (AAPL), Salesforce.com (CRM), and Amazon (AMZN)—are all trading well below their yearly highs.
The weekly RS analysis suggests that the QQQ is no longer outperforming the S&P 500, and the weekly close below the prior four-week lows (line b) is negative.
The 38.2% retracement support at $55.73 was broken Friday, with the 50% support now at $54.66.
There is first resistance now at $56.80 to $57.20, and a close above $58.23 is needed to improve the short-term trend.
The Nasdaq-100 A/D line is acting a bit stronger than prices, as it has held above the November lows (line d).
Russell 2000
The iShares Russell 2000 Index Fund (IWM) has been trading in a narrow range. It is still holding above the November lows at $70.96, and the daily chart still shows a short-term bull flag formation. There is further support in the $70 to $70.40 area.
The key 61.8% retracement resistance level is just above $77, and if it is overcome, we could see a rally to the downtrend in the $84 area.
The Russell 2000 A/D shows a similar formation as the price chart, suggesting that the selling in the small-cap stocks was not that heavy last week. A move through the A/D line resistance (line g) could signal that the small-cap stocks are starting to lead the market.
Sector Focus
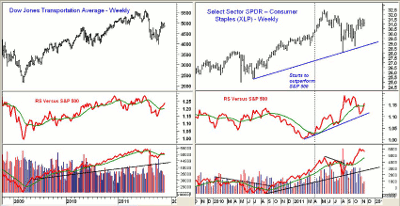
The Dow Jones Transportation Average held up quite well last week, as the four-week lows and support at 4,700 has held. Once above the resistance at 5,067, we could see a rally to the 5,250 to 5,400 area.
The RS analysis is positive for the Transports, as it is well above its rising WMA and turned up sharply last week. The weekly on-balance volume (OBV) is holding just above its WMA. A higher close this week on good volume will turn this pattern more bullish.
The Select Sector SPDR Consumer Staples (XLP) also held in a narrow range last week, trading inside the ranges of the prior week. There is short-term support now at $30 to $30.46, and a weekly close above $31.70 is likely to signal upward acceleration.
The RS analysis on the XLP turned up sharply last week, and has moved back above its WMA. This suggests that this sector is still leading the S&P 500. The weekly OBV continues to act much stronger than prices, as it is well above the 2011 highs, while XLP is still below its highs at $32.46.
The Select Sector SPDR Energy (XLE), the Select Sector SPDR Industrials (XLI), and the Select Sector SPDR Utilities (XLU) all acted well last week, as they held well above their rising 50-day MAs.
NEXT: Oil, Metals, and Tom’s Outlook
|pagebreak|Oil
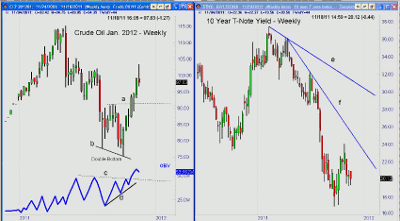
Crude oil completed its double-bottom formation (line b) four weeks ago, when it closed above the resistance (line a). The upside target from the formation is in the $106 to $107 area on the January crude oil contract. Last week’s high was $103.37.
The OBV confirmed the price action by breaking through its resistance (line c), and the OBV did form a positive divergence at the lows (line d). The OBV did make new highs this week, which is positive for the intermediate term.
Crude oil closed the week lower, as the candle formation shows a long tail. The next good support sits in the $95 to $94 area.
Interest Rates
The daily chart of the ten-year Treasury closed the week a bit lower, but is still holding well above the low yield of 1.69% in September. The next resistance is at 2.20%.
The initial weekly downtrend is at 2.46% (line f), with the longer term downtrend (line e) at 3.17%. The T-Bond futures were also higher (meaning lower yields), and show no signs yet of a top.
The interest-rate market will bear close watching as we head into the end of the year.
Precious Metals
The SPDR Gold Trust (GLD) was discussed in detail earlier today, and GLD did close a bit higher on Friday.
The iShares Silver Trust (SLV) tested key support last Thursday at $30.21, but closed well off the lows. A close below this level will be negative and suggest a drop to the $28 area, if not the downside target at $25.50.
The Week Ahead
Last week’s action was less positive than I expected, but there are still no signs that the year-end rally I have been looking for since mid-September is over. The action over the next two weeks is likely to be pivotal—if stocks are not moving higher by the end of next week, I will become more cautious.
The supercommittee deadline could be crucial, but given this holiday-shortened week, the real test may come the week after.
On long positions, continue to have your stops in place. The November 1 lows in the individual issues are likely to be more important than they are for the major averages.
I will have a special report available for next Friday, as the regular Week Ahead column will not be published on November 25.
- Don’t miss Tom’s latest Trading Lesson: No Need to Pick Bottoms or Tops


