Inflows from bondholders fed up with low yields could drive stocks significantly higher. And a few sectors should be ready to buy into at the next pullback, writes MoneyShow.com senior editor Tom Aspray.
The stock market’s initial rally phase from the October 4 lows has gone a bit further than even us bulls expected. I guess my question from last month, “Can Doom and Gloom Save the Market?" has been answered.
Clearly, the roadblocks to an economic recovery have not been removed. While the technical outlook for the stock market has improved dramatically, there is still some work to be done.
I expected a pullback sometime last week, but the buying was relentless. Once we get a two- to five-day correction, it will be the strength of the following rally that will help determine how far stocks can rally into the end of the year.
The individual investor, as measured by the AAII sentiment, has turned much less bearish over the past week. The bearish percentage has dropped from 45% to 36%. Still, after the bruising decline in August, it is hard to imagine that most investors will jump back into stocks without a good reason.
So where will the new buyers come from?
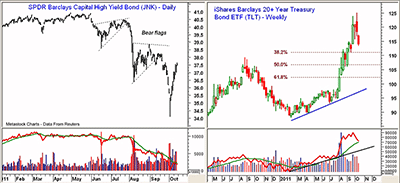
The junk bond market has lost much of its allure, as the SPDR Barclays Capital High Yield Bond ETF (JNK) has had a rough few months. It peaked at $40.93 in April and hit a low on October 4 of $34.09, a swing of 16.7%.
The chart shows that JNK formed several classical bear flag patterns as it declined. It could have made a panic low with the stock market, but the volatility is likely to keep many out of this market.
Both short- and long-term bond rates have moved higher, and the weekly chart of the iShares Barclays 20+ Year Treasury Bond ETF (TLT) shows that it has been hit by some heavy selling lately. It is almost 10% below the highs made just two weeks ago.
No confirmation yet of a major top, as the on-balance volume (OBV) did confirm the recent highs. Still, it could easily still lose another 2% to 4%.
It has been a rough year for the even the biggest bond player, as Pimco’s Bill Gross bet on higher inflation early in the year. His $242 billion Total Return Fund (PTTAX) has suffered, and is now ranked 552nd out of 604 similar funds.
The action in the bond market suggests that many are tired of the very low yields, and are now willing to accept more risk in search of better returns. Stocks are pretty much their only alternative.
The other positive for stocks is the bottom in the US dollar. Technically the dollar has completed a bottom formation, as the weekly chart of the PowerShares DB Dollar Index Bullish ETF (UUP) indicated on September 23. The US dollar is favored over the euro, and I expect the latter’s recent bounce to be brief.
If just a small portion of the funds that flowed into bonds early in the year move into stocks, it could push the major averages much higher. I think capital inflows into the US will also be a positive factor for the stock market.
The apparent acknowledgement by the Euro countries of the severity of their problem is getting much of the credit for the strong stock market. It is encouraging that some of last week’s negative news didn’t stop stocks from moving higher, but it will likely be an overseas development that triggers the next meaningful correction.
Though the markets have likely factored in a default by Greece, the Eurozone problems are a long way from being solved. Inflation in the Eurozone has surged—it moved a full point above the ECB’s target rate.
Emerging markets are also still a concern, as every economic number from China is being watched closely. Their latest inflation numbers did show a slight decline in September. The Shanghai Composite was also higher last week, as it tries to stabilize at the 2010 lows.
US economic news was generally positive. Retail-sales data on Friday was better than expected. The weaker consumer-sentiment numbers did dampen the enthusiasm somewhat.
This week, we have a full slate of economic reports, plus many major companies scheduled to report earnings. On Monday, we get the industrial-production numbers and the Empire State Manufacturing Survey. The monthly Producer Price Index follows on Tuesday, and Wednesday brings the Consumer Price Index.
Also on Wednesday, we hear about housing starts, followed Thursday by jobless claims, existing-home sales, leading indicators, and finally the Philadelphia Fed survey.
NEXT: What to Watch
|pagebreak|WHAT TO WATCH
This week’s action in the stock market supported my view from last week that a sustainable bottom has formed. That does not mean we will head straight up, as there are still plenty of market bears looking for a reason to sell.
The most important development last week was the improvement in the market internals. Though prices are still locked in their trading ranges, the A/D lines on the S&P 500, Dow Industrials, and Nasdaq-100 have broken out of their ranges.
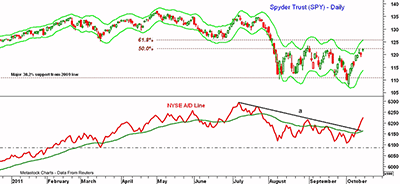
The NYSE A/D line is the broadest measure of the market internals, and it shows that the downtrend (line a) has been convincingly broken. The A/D line moved above its weekly moving average last Monday, and the WMA is now clearly rising.
Though the NYSE A/D line did slightly violate the August lows, the other A/D lines did not. It was also positive that the A/D line held the panic lows from late March. When the A/D lines are acting stronger than prices, it is an indication that corrections will be well supported.
S&P 500
The Spyder Trust (SPY) dropped briefly to support at $119 on Thursday, before closing the week very strong. The 50% Fibonacci retracement resistance calculated from the April highs is $122.50, and was SPY closed above that on Friday.
The daily Starc- band is now at $125.61, and corresponds nicely to the major 61.8% retracement resistance level. I would expect to see some sort of pullback before the SPY challenges this resistance level.
There is minor support now at $120.50, with a further level in the $118 area. Once we get a lower daily close, we will be able to identify the short-term Fibonacci support levels. There is good chart support now in the $115 to $117 area.
Dow Industrials
The Spyder Diamonds Trust (DIA) slightly exceeded its major 50% retracement resistance level at $116.24 in Friday’s session. The early-September high is nearby at $117.04.
There is a strong barrier of chart resistance (the June low) and the 61.8% resistance level at $119.16.
The Dow Industrials A/D has broken out of its trading range, and I would expect the large-cap stocks to lead the market during the initial rally phase.
NEXT: Small Caps, Sector Focus, and Tom’s Outlook
|pagebreak|Russell 2000
The iShares Russell 2000 Index Fund (IWM) has been the weakest of the market average ETFs since April, but it regained some of those losses in the past two weeks.
It is up over 16% from the lows, but is still below the September highs at $72.03. The 50% resistance level is at $73.45, with the upper boundary of its trading range at $73.89. The 61.8% resistance is significantly higher at $76.60.
The Russell 2000 A/D line has broken its downtrend from the summer highs, and is starting to act stronger than prices. There are no signs yet from the RS analysis that either the small or mid-cap stocks are starting to outperform the S&P 500.
There is minor support for IWM at $68 to $68.50, with stronger levels in the $65 to $65.50 area.
Nasdaq-100
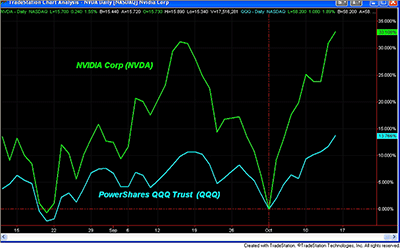
The PowerShares QQQ Trust (QQQ) has had a dramatic run over the past eight days, surging from a low of $50.10 to a high on Friday of $58.04. During the sharp decline early October 4, it held above the prior lows of $49.99 and $49.93.
Since the October lows, QQQ is up over 13% while semiconductor maker NVIDIA (NVDA) is up a whopping 32%-plus. One should note that it had just dropped 30% from the September highs, so this is definitely not a stock for the faint-hearted.
As we get further into earnings season, expect some further positive surprises from the tech sector on the earnings front, like Google (GOOG), which reported very strong numbers last Thursday. The next resistance for QQQ stands at $59 to $59.90, with trend line resistance above $60.50.
The Nasdaq-100 A/D has broken out of its trading range and continues to show great strength.
There is first support now at $55.50 to $56, with stronger levels sitting at $54.50.
Sector Focus
Retail stocks have been some of the star performers over the past two weeks, and I think they will continue to be leaders for the rest of the year.
Earlier today, in “Gaining an Edge with Retail Stocks,” I reviewed some of my prior picks in this group, and gave some new recommendations for possible pickups on a correction.
The rally has been pretty broad-based. Even some of the recently weak sectors, like energy , materials, and industrials, have also had nice moves. I will be looking for signs that they may have formed intermediate-term bottoms, as all topped out in May.
NEXT: Commodities and Tom’s Outlook
|pagebreak|Oil
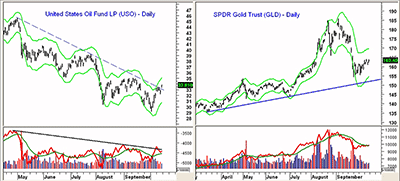
Crude oil also had a nice rebound, and the weekly studies on the United States Oil Fund (USO) are very close to confirming an important low. The daily chart shows that the downtrend (line a) has been broken, and a close above $35.10 would be quite positive.
The daily on-balance volume (OBV) moved slightly through its downtrend last week, tested its WMA, and is now again turning higher. This is a positive short-term formation.
Precious Metals
The SPDR Gold Trust (GLD), after trading below the weekly and daily Starc- bands last month, has been in a shallow uptrend.
There is still strong resistance at $165, with the 50% Fibonacci retracement level standing at $170. The daily OBV is just testing its flat WMA, as volume has been declining for the past few weeks.
A break below support at $158 may signal another wave of selling. There is stronger chart support and the daily uptrend in the $152 area.
I think it will take more time before gold and GLD are ready to start another significant rally. But remember, the major trend is still positive.
The iShares Silver Trust (SLV) has also relieved its short-term oversold status, but at any sign of weakness I expect further liquidation. There are just too many weak hands in this market. A drop to the $25 to $26 area is not out of the question.
The Week Ahead
With most of the major averages closing on their highs for the week, some may be asking themselves whether they should just jump in now and buy.
My advice would be no. Even though it has taken longer for the market to correct than I expected, one will come eventually.
The only alternative scenario in my experience is for the market to develop a new three- to five-day trading range before it continues higher. Given the skepticism over the recent rally I think this is less likely.
Patience is a valuable tool for investors. Way too many trades go bad because of a poor entry. A correction, when it comes, may be sharp enough for some to question whether they should be buying at all. That is why it is important to determine your entry points and stops ahead of time so that your orders can be in the market.
The first significantly lower daily close should allow us to better identify the key support levels. For 401(k) investors, I would suggest you use a market correction to raise your equity exposure.


