As often happens, strong bearish sentiment helped boost the market all week, but it’s best to wait to buy until a pullback occurs, which could come as early as mid-week, writes MoneyShow.com senior editor Tom Aspray.
The stock market got very close to the key levels in the major stock ETFs Monday, and then spent the rest of the week rebounding. This was in spite of very little in the way of positive news, either on the US economy or the Euro debt crisis.
As this sampling of financial headlines reflects, there was little to cheer about:
- Europe Lending Woes Deepen
- Economy Clips Factories
- Greek yields off the scale as 3-year bond hits 172%
- Number of Americans in poverty at highest in 50 years
Some of the Euro pain was lessened last Thursday, after the world’s central bankers moved to offer unlimited dollar funding through the end of the year. This helped the hard-hit European banks, especially those in France, to rebound.
The news on our economy was not a big help. Retail sales were flat and Best Buy (BBY) reported 30% drop in income for the second quarter. Retail sales were hurt by the several days lost because of Hurricane Irene.
A recent survey of economists by The Wall Street Journal sees a 1 in 3 chance the US will slip into a recession. They also put even odds that the euro would breakup.
The Conference Board was even more negative on the economy, as they see a 45% chance that there will be a recession.
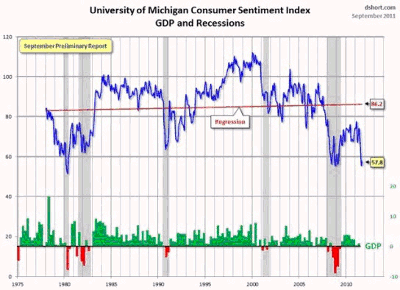
The Michigan Consumer Sentiment Index, released last Friday, shows a slight pickup from August’s dismal numbers. This chart from the Business Insider shows that consumer sentiment is already at levels seen in past recessions.
By the time this index drops below 60, GDP has already turned negative. While almost all economists are still downgrading their GDP forecasts to the 2% to 2.5% range, few are negative.
In light of all this, most were surprised that the Spyder Trust (SPY) was up 4.8% for the week, while the tech heavy PowerShares QQQ Trust (QQQ) led the way with a 6.4% gain.
Clearly, sentiment has shifted—the Investors Intelligence survey of newsletter writers shows that only 35.5% are bullish, compared with over 57% in early April. Also, 40.9% who are bearish, which is not far from the 47.2% level that was recorded near the March 2009 lows.
Another reading of sentiment comes from the option activity. Option expert Larry McMillan reports that put/call ratios have turned positive, as too many are buying puts in expectations of another sharp market decline.
Therefore, stock investors will be helped by an increased feeling of pessimism about the stock market and the economy. As I discuss further below, there has been some technical improvement.
The IMF meeting may set the tone for Monday’s opening. Tuesday, we get the housing starts as well as the start of the FOMC meeting. Wednesday’s existing-home sales numbers are likely to have much less impact than the FOMC announcement in the afternoon.
A clear majority of economists expect the Fed to do something. The prevailing choice is what is being referred to as “Operation Twist," where the Fed exchanges shorter-dated Treasuries for bonds in an effort to drive down long-term rates.
However, the dramatic rally in the US bond market suggests this already may be priced in.
NEXT: What to Watch
|pagebreak|WHAT TO WATCH
One of last week’s casualties was the euro. Watch it closely this week, because a further break could exacerbate the Eurozone problems. Gold had another sharp setback last week, but finished the week strong and well off the lows.
The stock-market rally last week clearly improved the technical outlook, as many of the major averages came very close to key support on last Monday’s opening. Further strength is needed this week to signal a rally above the prior highs, which would likely stop out a few of the short positions.
After the current rally runs its course, the following pullback will be important. It will give us a better idea of whether a test of the August lows lies ahead.
S&P 500
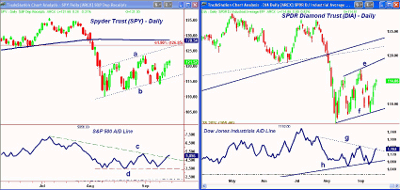
The Spyder Trust (SPY) made it up to $121.97 on Friday, which was just below the prior closing high. Traders likely have stops now above $123.51.
The upper boundary of the flag formation (line a) and the 61.8% Fibonacci retracement resistance is at $126.85. A daily close above this level will suggest that the August lows will hold.
Monday’s low at $114.05 briefly violated the lower support from the flag formation (line b) at $114.38. There is short-term support now at $119, with stronger levels in the $116 to $116.60 area.
The number of advancing issues was strong last week, as the S&P 500 A/D line has moved slightly above its downtrend (line c). It needs to rally higher to suggest that a short-term uptrend is in place.
It is important that key support (line d) holds on any correction.
Dow Industrials
The Spyder Diamonds Trust (DIA) dropped below support at $109.18 on Monday, down to a low of $108.15, before reversing to the upside. The next level of resistance to watch is between $115.30 and $117.03, which was the high of the previous rebound.
The 50% retracement resistance stands at $117.78, with the trendine resistance (line 3) at $118.60.
First support for DIA is now at $113, with stronger levels in the $109.90 to $112 area.
The Dow Industrials A/D closed for one day below the long-term uptrend (line h) before reversing. It closed Friday just barely above the near-term resistance. A move well above the prior peak will improve the technical outlook.
Next: Technology’s Strong Rebound and Sector Focus
|pagebreak|Nasdaq-100
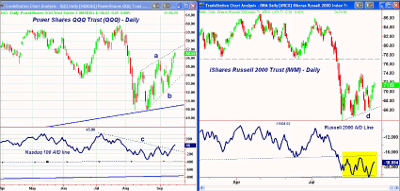
The strength in the PowerShares QQQ Trust (QQQ) got the market’s attention last week, as it gained 6.4%. QQQ was able to close above the 61.8% retracement resistance at $56.07 last Thursday.
In Friday’s article, I took a close look at not only the PowerShares QQQ Trust (QQQ), but also the Select Sector SPDR Technology (XLK), Semiconductor HOLDRs Trust (SMH), and Apple (AAPL). The particularly bullish action in AAPL, a market leader, is a positive for the overall market.
Friday’s high was very close to the start of the next resistance at $56.80 to $57 (line a), with the 78.6% retracement resistance next at $57.71.
There is initial support at $55.20, with stronger support sitting at $54 to $54.50. A close below Monday’s lows of $52.57 would suggest the rally is over.
The Nasdaq-100 A/D line is acting the strongest, as it has convincingly broken its downtrend (line c) and has moved above the prior peak. This is consistent with a bottom formation. This was the only A/D line to hold above the 2011 support.
Russell 2000
The iShares Russell 2000 Index Fund (IWM) was up almost as much as the QQQ, but the chart still looks weaker. If we have begun a sustainable new rally, then the small- and mid-caps should eventually start to outperform.
There is next resistance at $72.50 to $73.84, with the major 50% retracement resistance at $74.82. Support now sits at $66.37 to $65.93, which if broken will signal a drop to the major 50% support at $60.54.
The Russell 2000 A/D line continues to look quite weak, as it dropped to new lows before last week’s rebound. It is still well below the previous highs.
Sector Focus
All of the major sectors were higher last week, but only technology was able to overcome the previous highs. The Select Sector SPDR Utilities (XLU) was a bit lower Friday, but it still looks like one of the strongest sectors.
For a healthy market, we need more than just these two sectors to push prices higher. It is possible that the Select Sector SPDR Consumer Staples (XLP) and Select Sector SPDR Health Care (XLH) will be able to breakout above the previous highs.
Oil
November crude oil held up well last week, and has reached the apex of its triangle formation. Therefore, an upside breakout above the resistance at $90.52 would be suspect.
The daily chart shows an apparent flag formation, which is likely just a pause in the downtrend. There is initial support now at $85, which is almost $3 below Friday’s close. A daily close below the $83.20 level would be more negative.
NEXT: Metals, the Dollar, and Tom’s Outlook
|pagebreak|The Dollar
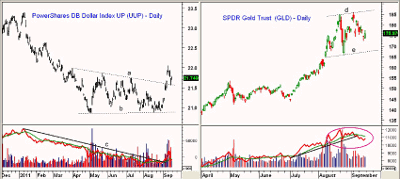
The Powershares DB Dollar Index Up ETF (UUP) has had a nice bounce, as the resistance at $21.74 was finally overcome. On a move above last week’s highs at $22.05, the next targets are in the $22.50 area.
UUP has its next support in the $21.40 to $21.50 area. Volume was good on the recent rally, as the on-balance volume (OBV) moved back above its WMA and through resistance (line c).
Precious Metals
The Spyder Gold Trust (GLD) hit a high on September 6 of $185.85, but dropped to a low last week of $172.65. GLD did close well above the lows.
A broad trading range is evident on the daily chart (lines d and e), with important support now in the $167-$168 area.
As I noted previously, the weekly OBV did not confirm the early September high, and the daily OBV is now below its declining WMA. This is consistent with a further decline.
There is resistance for GLD now at $180 to $182.
The iShares Silver Trust (SLV) got very close to the key support at $38, as last week’s low was $38.20. There is strong resistance in the $40 to $41 range.
The Week Ahead
The stock market’s ability to shrug off the high level of pessimism last week could carry over at least early this week. The markets are likely to be quiet as we get closer to the FOMC announcement on Wednesday.
Action by the Fed should give the market a boost, but if it is close to resistance, it may not last long. I would expect a correction by the end of the week, if not sooner, and would not be buying near last week’s highs.
Those who are nervous about their equity exposure should use any further strength to raise cash. If you are underinvested in stocks and looking to buy, a decent pullback should provide a good opportunity, especially in the technology sector.
- Don’t miss Tom’s latest Trading Lessons, Using Fibonacci to Trade Flag Patterns and How to Get Started in Chart Reading.


