We won’t know for a while whether the bulls have been truly slaughtered, so investors would do wise to wait for the near-term rally that will likely follow Friday’s down close, writes MoneyShow.com senior editor Tom Aspray.
Last week provided more thrills and chills for stock investors. The bulls got some relief early on: stocks rebounded to first resistance by mid-week, before Eurozone fears fueled another massive down day.
Somewhat bizarre comments from a Swedish finance official that the interbank funding market was fragile raised concerns that European and United Kingdom banks might be in trouble because of a lack of liquidity.
Most of these banks, like Lloyds Banking Group (LYG) and the Royal Bank of Scotland (RBS), have looked weak since since early in the year and are already down over 50% year to date.
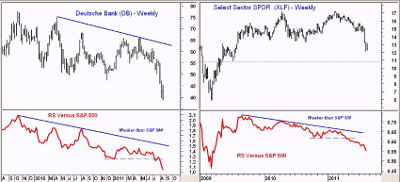
The relative performance, or RS analysis, of two large Eurozone banks, Banco Santander (STD) and Deutsche Bank (DB), suggests that they can still go lower despite last week’s plunge. Therefore it is likely that additional concerns about these banks will surface over the next few months, adding fuel to future downdrafts.
Of course, US financial stocks were also hit, with the Select Sector SPDR Financial (XLF) at its lowest level since July 2009. The RS line on XLF has been accelerating to the downside all year, indicating it would be weaker than the major averages.
While the large banks are overdue for a small jump in prices, I caution investors not to get caught up in these potential “value traps."
Cash-rich companies are still on their buying binge, with Google (GOOG) buying out Motorola Mobility (MMI) for about $12.5 billion last Monday.
This gave the market a boost early last week, but not all of the news was positive; Dell’s (DELL) future guidance disappointed the market, and Hewlett Packard (HPQ) also was hit hard after it announced plans to sell its PC business. HP stock was down 20% on Friday.
Last week’s sharp drop, and worse than expected economic numbers from both the US and Germany, have pushed more analysts into the bearish camp. Growth expectations for the US economy continue to get downgraded, as JP Morgan joined what The Wall Street Journal called the “GDP Downgrade Party” late in the week.
In light of these cross-currents, Treasury yields plunged further, with the yield on the ten-year Treasury dropping to its lowest level since late 2008. Gold continued its amazing run, and the decision by Venezuela’s President Hugo Chavez to nationalize their gold industry likely supported the rally.
Over the next year, rates are likely to continue lower and gold should move even higher, but both are looking ever more vulnerable to a sharp setback.
Most of last week’s news on the economy was negative. US inflation surged on higher food and energy costs. This week there are relatively few major reports scheduled, but keep an eye out for new-home sales on Tuesday and durable goods on Wednesday.
On Thursday, we get the latest read on jobless claims (last week’s numbers were disappointing), and on Friday we get the preliminary reading on second-quarter GDP, which is likely to be widely watched.
NEXT: WHAT TO WATCH
|pagebreak|WHAT TO WATCH
As I noted before Friday’s opening, the weekly and daily technical indicators are not in sync. While the daily analysis still suggests a test or break of the recent lows, the weekly does not suggest a major top is in place.
For charts of the Spyder Trust (SPY) and Spyder Diamonds Trust (DIA) please see “Can Stocks Hold the Lows?"
The market’s recent decline still looks more like the crash of 1987, which was followed by an equally sharp rebound. While the bearish camp is getting more and more crowded—and while they ultimately may be right—students of market history know that bear markets take time to develop. Not all have the same structure, but all are marked by rather dramatic rallies that often last long enough to shift market sentiment.
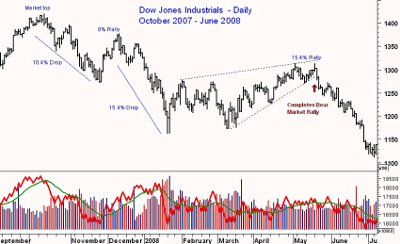
This chart shows the October 2007 top in the Dow Jones Industrials, which was followed by a 10.4% drop into the latter part of November 2007. This was only half as severe as the recent decline. The Dow rallied 8% in the next three weeks before the decline resumed.
The leg down for the Dow lasted until January 22, and was a 15.4% decline from the December highs. Measuring from the October highs, the Dow had lost over 22%.
This turned the sentiment extremely bearish, and by early February most analysts were convinced a new bear market was underway.
The Dow Industrials stayed in a broad trading range until March, when the Dow gained strength. This rally lasted until the middle of May. From the January lows, the Dow had rallied over 15%, which was enough to convince many of those who were bearish in February that bear market was over, or that it never existed. Of course, from these highs the Dow dropped another 50%.
The key point is that we should have conclusive evidence in the next month or two whether we are in a bear market or not...and that if you want to sell, there is likely to be a better opportunity before then.
If you would like to learn more about the history of bear markets, you can read my article “Bear Market Rallies - Part 1,” which was published in June 2008.
S&P 500
The Spyder Trust (SPY) exceeded the 38.2% resistance Wednesday before it turned lower.
The major 38.2% Fibonacci support level at $110.41 was slightly exceeded last week. There is a band of support from summer 2010 in the $105 to $108 area, with the 50% retracement support at $102.14.
SPY has initial resistance now at $118, with stronger resistance in the $120.50 to $121.20 area. The S&P 500 A/D line is declining, but so far has held above the recent lows.
Dow Industrials
The rebound in the Spyder Diamonds Trust (DIA) failed below the 50% resistance at $116.64. The DIA closed on the week’s lows, just above a band of strong chart support at the $107 area, with next key support at the 38.2% retracement level of $105.46.
The Dow Industrials’ A/D line continues to act much better than that of the S&P 500, but I will be watching it closely on the current decline.
Nasdaq-100
The PowerShares QQQ Trust (QQQ) had a nice rally up to first resistance, but stalled below $54.50 just before the surprising news from Hewlett Packard pulled out the rug from under the rally.
The QQQ gapped lower Thursday and continued lower on Friday. It closed just above the August 9 lows at $49.93 and the uptrend from the July 2010 lows.
The major 38.2% support from the 2009 lows is at $46.54, but there is some minor support in the $48 area as well. The resistance is strong now at the gap in the $52.14 to $53.02 area.
Russell 2000
The iShares Russell 2000 Index Fund (IWM) closed at new correction lows Friday, which makes the next likely target the 50% support in the $60.54 area. The IWM bottomed in July 2010 at $58.66.
The Russell 2000 A/D line has also turned lower, but is still holding above trend-line support, while prices have broken similar support.
NEXT: Sector Focus, Commodities, and Tom’s Outlook
|pagebreak|Sector Focus
The rally in the Dow Jones Transportation Average was the weakest, and closed Friday well below the early-August lows. The major 38.2% support has been broken, with the 50% support at 3,878.
The Transports have are still trading below the weekly Starc-bands, which favors some consolidation, if not a rally, over the next few weeks.
On Monday, I took a look at the sectors that were still positive for the year and were clearly acting better than the S&P 500. There were three that were looking positive based on the RS analysis, and while the Technology sector was hit hard, its RS analysis is still in an uptrend.
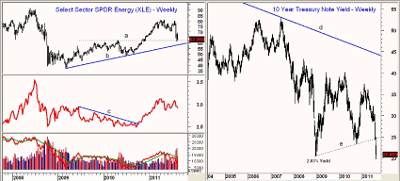
The Select Spyder SPDR Energy (XLE) is also starting to look more interesting, as the plunge in crude oil seems to be overdone. The chart shows that the support from the 2010 highs (line a) is now being tested.
The long-term uptrend (line b) is just below the $60 level. The RS line is also holding above its lows, and this is an encouraging sign.
Oil
October crude oil closed unchanged on Friday, but down over $3 for the week, after losing almost $6 in one day on Thursday. It is still above the August lows of $76.15.
If these lows are broken, the next good support is in the $70 to $72 area. This drop should be positive for drivers, and indirectly, of course, the consumer sectors.
Interest Rates
Rates continued to move lower last week, as the weekly chart of the ten-year Treasury shows that it has broken support going back to the 2008 lows. This suggests that rates could still go lower, and the chart projects a drop to 1.5%—hard to believe, but possible.
Precious Metals
Gold prices were on a tear last week, as the SPDR Gold Trust (GLD) gained another $10 to close near $180. As I recommended in Thursday’s analysis, with the move above the weekly and monthly Starc+ band the prudent choice is to protect some of your profits.
Getting greedy is never a good idea. With the likelihood of more margin hikes in the coming months, we could see a very sharp correction within the major uptrend.
The iShares Silver Trust (SLV) has finally turned higher and closed last week strong. Next resistance awaits in the $42.50 to $43 area, with key support at $38.
The Week Ahead
The rollercoaster ride was a bit tamer last week, even though stocks closed on a negative note Friday. This could lead to some follow-through selling early in the week, and a drop to or below the August lows looks likely.
Nevertheless, I still expect a better rally to develop over the coming weeks, and I hope you sold out any weak longs above 1,200 on the S&P, as I suggested last week. Even if the utility stocks correct more from their highs, they would still look more attractive than either Treasuries or gold.
More Top Headlines:


