It’s possible that big-time redemptions caused several would-be rallies last week to sputter and die. A short-term rally remains likely, but if the sell-offs continue, June's lows could be tested, writes MoneyShow.com senior editor Tom Aspray.
It was clearly a rough week for stocks. Despite historic oversold readings after last Monday’s selling, rally attempts have been feeble. Typically, such an oversold market would stage a decent one- or two-day rally, but it never came last week.
Selling by hedge funds could be keeping the market lower...as several days last week, stocks opened strong only for the rally to fizzle quickly. June saw the highest level of hedge-fund redemptions since October 2009, and I doubt things have gotten better in July, as most apparently missed the rally.
For the year, the HFN Hedge Fund Aggregate Index is up just 0.63%, against over 6% for the S&P Total Return Index. Therefore one can see why hedge-fund investors may be looking elsewhere: If the hedge funds are selling in order to meet redemption requests, it could explain the recent action.
Obviously, the stock market and economy had enough barriers to overcome last week without the hedge funds. Early last week, concerns over Italy’s debt surfaced, and of course the ongoing stalemate over the debt ceiling has many worried.
Adding to the volatility were hopes of QE3 after Fed Chairman Ben Bernanke’s testimony. He clarified his comments on Thursday, and stocks quickly sold off.
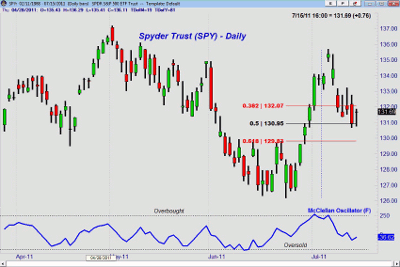
From a technical standpoint, the market is reaching a critical juncture. As the chart of the Spyder Trust (SPY) indicates, the 50% support level at $130.95 was violated Thursday. This makes the 61.8% level at $129.85 more important.
The McClellan oscillator is an advance/decline indicator that measures whether the market is overbought or oversold. On July 7, it stood at +258 (overbought), but closed Friday at -36.
It is trying to turn up, and is now oversold enough to fuel a rally. One is likely by mid-week.
Gold broke out of its recent trading range in impressive fashion, and looks ready to go even higher. Crude oil also finished the week on a strong note, and overall the firming in the commodity markets suggested to me that the commodity markets had turned the corner.
Most of the economic data last week was better than the horrible job numbers, but not good enough to get anyone excited. The inflation numbers reflected the lower crude-oil prices, retail sales were just barely positive, and consumer sentiment was the weakest in over two years.
This week, the focus will be on earnings reports, as the economic calendar is light. So far earnings have been better than expected, but this has not helped the market.
On Tuesday, we have housing starts, followed by existing home sales on Wednesday. Then on Thursday, in addition to the weekly jobless claims, we get the Philadelphia Fed survey.
NEXT: WHAT TO WATCH
|pagebreak|WHAT TO WATCH
The sentiment picture reflects that both individual investors and financial newsletter writers are still positive on the market. There has been little change over the past two weeks.
Of course, this must be viewed from a contrarian standpoint, as it could reflect a level of complacency that is negative for the market. An increase in bearishness would be more positive.
Last time, I was looking for a six- to seven-day correction, like we saw in April. Friday marked six days since the high. Clearly, the action early this week will be important
S&P 500
The key support level for the Spyder Trust (SPY) is now $129.80. From a technical standpoint, a daily close below this level will indicate a drop back to the $125 to $127 area.
A close back above the $133 level is needed to signal that the correction is over, while a failed rally to this level would be negative.
As noted last week, the S&P 500 A/D line did make convincing new highs on July 7. It is still above its uptrend from the June lows. A break of this uptrend will indicate a drop back to the June lows.
Dow Industrials
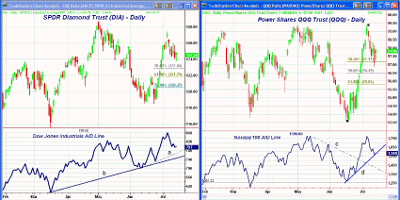
The Diamonds Trust (DIA) has held up much better than the SPY, as the 38.2% support level at $123.93 was only slightly violated last Friday.
The more important 50% support is at $122.83, and a close below $121.79 would be negative.
The Dow Industrials’ A/D line has just corrected back to the late June highs, which is the first good support. It is still well above both its short-term trend (line a) and longer-term support (line b).
Nasdaq-100
The PowerShares QQQ Trust (QQQ) got a boost on Friday due to the much better than expected earnings from Google (GOOG). The tech giant alone comprises 5% of QQQ.
The 38.2% support level was broken on Thursday, and the A/D on the Nasdaq-100 closed right on its short-term uptrend (line d). It was the move above the downtrend (line c) in the A/D line in late June that signaled the recent rally.
The 50% support level for QQQ is $56.47, and this now becomes more important. A close above last Wednesday’s high of $58.34 would be the first strong sign that the uptrend had resumed.
Russell 2000
The iShares Russell 2000 Trust (IWM) is also acting better than the SPY, as it is still above its 50% support level at $81.60.
The Russell 2000 A/D line also looks stronger than that of the Nasdaq-100. It was weaker than the others in April, which turned out to be a strong warning.
There is key short-term resistance now at $84.47, which needs to be overcome to signal a stronger rally in small-cap stocks.
NEXT: Sector Focus
|pagebreak|Sector Focus
The Dow Jones Transportation Average has been leading the market higher for over two years. For the first time, there are signs that it may be topping.
The Transports were hit with heavier selling last week, and convincingly broke below the 50% support at 5,333. The key 61.8% support stands at 5,265.
This has caused some significant technical damage. For the first time since the 2009 lows, the on-balance volume (OBV) has not confirmed a weekly high. This negative divergence has not yet been confirmed, but could be this week.
This would mean that this sector and possibly the market in general is going to decline further. (To learn more about OBV and see my analysis of the Transports, please read my recent post.)
The Select Sector SPDR Financial (XLF) and Select Sector SPDR Materials (XLB) had the best weeks overall, followed by the Select Sector SPDR Technology (XLK).
The Select Sector SPDR Financial (XLF) was under pressure all week. Despite the better than expected earnings from JPMorgan Chase (JPM) and Citicorp (C), it closed very near the June lows at $14.62. A break to new lows would add additional pressure on the S&P 500.
The Select Sector SPDR Health Care (XLV) also closed very weak, and has broken below its 61.8% support level. The next key support can now be found in the $34.50 area.
Oil
Crude oil rallied Friday and closed the week a bit higher, but still needs to overcome the resistance at $101.73 to $103.40 (for the September contract) to turn the momentum clearly positive.
The volume action is positive and does suggest accumulation. Important support now sits at $93.80.
US Dollar
The PowerShares DB US Dollar Index Bullish Fund (UUP) continues to trade in a narrowing range. Despite all the turmoil last week, it has held up surprisingly well.
Conventional wisdom suggests a debt default would put heavy selling pressure on the dollar. For UUP, there is resistance at $21.74 and support at $21.19.
Gold
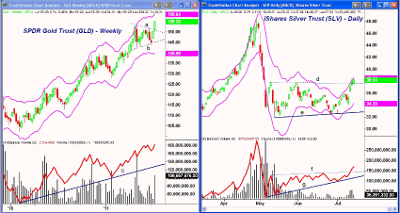
The SPDR Gold Trust (GLD) closed above the resistance at $151.65 last Tuesday, and surged to the upside. Volume was strong last week.
The upper weekly starc band is currently at $158.61. The completion of the trading range (lines a and b) has upside targets in the $160 to $164 area.
Minor support at $153 and a test of the $152 area is possible in the next week. It would be a buying opportunity.
The weekly on-balance volume is in a strong uptrend (line c), and is confirming the price action.
Silver
The iShares Silver Trust (SLV) was also able to break out of its trading range (lines d and e). It closed Friday at the daily starc+ band, indicating it was at a high risk area to buy.
Given all this, it may consolidate for a few days before it is ready to move higher. The next strong resistance stands between $39 and $40, with major resistance in the $42.10 to $43.30 area.
The OBV did confirm the price action, as it overcame the resistance (line f). There is support now at $36.40, and stronger levels at $35.50.
The Week Ahead
Last week’s violation of the 50% support in the SPY, as well as the potential topping pattern in the Transports, do have me a bit more concerned about the market.
The market is oversold short term, so a bounce is very likely early in the week. It may come in reaction to a resolution of the debt crisis. However, any rally will need to be watched closely, as a one- or two-day bounce that fails to overcome the resistance levels outlined earlier could set the stage for another wave of selling.
The new highs in the A/D early in July mean that a major top has not been completed, but if the market fails to resume its uptrend this week, a broad trading range becomes more likely. In such an environment, stock picking will be the key.


