Like markets sometimes do, fortunes changed nearly overnight, and a rally took firm hold all last week. So firm, in fact, that a correction next week could be a time to buy, writes MoneyShow.com senior editor Tom Aspray.
Just a week ago, the financial news was pretty dire, as stocks closed near their lows and everyone was piling into three-month T-Bills that had almost no yield.
Stocks started off last week on a positive note, but it took until Wednesday or so before most paid any attention. The fireworks came at the end of the week, when those short the market were forced to cover their positions.
Stocks put in their best weekly percentage performance in a year, and rates rose sharply, with the yield on the ten-year note rising from last week’s close at 2.87% to 3.20% on Friday. That is an 11.4% increase in a week.
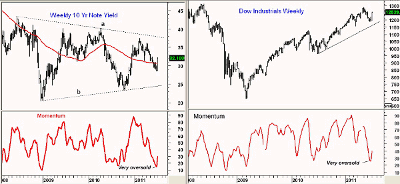
The weekly yield chart shows that momentum has turned up from the most oversold levels since 2009.
Typically, this strong a momentum reversal favors higher yields over the next few three to six weeks, if not longer. The close above the 50-day moving average suggests we could see a move to the 3.50% to 3.65% area, which is the upper boundary of the recent trading range (line a).
Last Tuesday, I commented that, “The short-term technical action suggests to me that now is a high-risk time to buy Treasuries." Waiting for significantly higher yields still seems like a good idea.
A similar chart on the right, of the Dow Industrials, shows that its weekly momentum has also turned up from the most oversold levels since last summer. It was up 5.2% last week, and after a pullback this week it should continue to move higher.
For a more detailed analysis with the key levels to watch, see the “What To Watch” section below.
There were also some wild swings in the commodity markets, as while crude oil rallied, the precious metals moved lower. Maybe the lack of anything more dramatic at the end of QE2 disappointed the precious-metal bulls. From a seasonal standpoint, metals do typically bottom later in the summer.
Some of the major commodity ETFs are now at important support where a bottom could be expected. Also, there was lots of volatility, as the crop report was bearish for corn and it plunged.
This week, the focus is again primarily on jobs. The ADP Report is out Wednesday, with jobless claims Thursday and the key monthly jobs report on Friday.
The expectation seems to be for another weak job report. If the stock market has had a decent pullback before Friday, a better than expected report could add fuel to the rally.
Also out this week are factory orders on Tuesday and the ISM Non-Manufacturing Index on Wednesday.
NEXT: WHAT TO WATCH
|pagebreak|WHAT TO WATCH
The stock market has already exceeded the targets I gave on June 22. Since both the S&P 500 and the Dow Industrials have surpassed the 61.8% retracement levels, it sets the stage for a test of early-May highs.
S&P 500
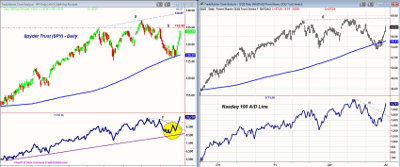
The Spyder Trust (SPY) opened the week at $126.89 and closed near the highs at $133.97. The key resistance at $129.81 was overcome on Wednesday’s opening, signaling that the correction was really over.
The next chart resistance is at $134.92 (line b) and the May 31 highs. The upper trend line resistance (line a) is now at $138.81.
The S&P 500 A/D line broke through its short-term downtrend last Tuesday, confirming the bottoming formation (in yellow). Further resistance (line c) was then overcome, and the A/D line has now moved above the previous highs.
This is very bullish action as the A/D line is now leading prices higher, so a pullback should be a buying opportunity.
Once we get a lower daily close, the support levels will become clearer. For SPY, the initial support is now at $132 to $131.40, with stronger levels at $130.70. Key support sits at $129.80.
Dow Industrials
The Diamonds Trust (DIA), after making marginal new lows the previous week at $118.41, accelerated through the 50% resistance at $123.57 and the 61.8% at $124.75.
There is next resistance for DIA at $125.55 and then $126.48. The May high follows at $128.63.
The break in the downtrend of the Dow's A/D line, as I noted last time, was certainly a leading indicator. It continues to act well, and now shows a clear uptrend.
DIA has initial support now at $122.80 to $123.30, with stronger at $121.90 to $122.20.
Nasdaq-100
The PowerShares QQQ Trust (QQQ) was able to surpass the resistance at $55.47 on Tuesday, as it has shown better relative performance since the mid-June lows.
There is next resistance at $58.36 and then major at $59 to $59.37 (line d).
The A/D line on the Nasdaq-100 has surged over the past week, breaking its downtrend (line e). It has not yet made new highs, so I will be watching it closely.
There is initial support now at $56.80, with stronger in the $55.50 to $56 area.
Russell 2000
The iShares Russell 2000 Trust (IWM), like the QQQ, formed higher lows than the S&P 500. The move through the prior week’s high of $81.11 was very bullish.
The next level of resistance to watch is in the $84.86 to $85.54 area. There is initial support for IWM at $81.80 to $82.20, with more important at $80.80 to $81.11.
NEXT: Sector Focus
|pagebreak|Sector Focus
Of course, all of the sectors were up last week, though some lagged the major averages, as the rally has been broad based.
Those that I had previously recommended in "Sweet Summer Sectors" look positive, with the XLY showing the best gain of 6.5% for the week. All do appear to have completed their corrections.
- Select Sector SPDR Health Care (XLV) +3.4%
- Select Sector SPDR Consumer Staples (XLP) +2.8
- Select Sector SPDR Utilities (XLU) +3.0
- Select Sector SPDR—Consumer Discretionary (XLY) +6.5
The Select Sector SPDR—Technology (XLK) was up over 5%, and could lead on the next rally. The energy sector was up over 7% for the week, but the weekly analysis still does not look that positive.
Oil
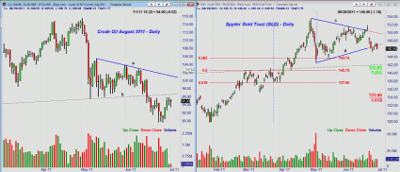
The August crude-oil contract made a low on Monday of $89.61, and rallied $5 from the lows. Still, August crude is below the strong resistance (line b) at $96.50. The downtrend on the daily chart (line a) is now at $101.20.
The intermediate-term outlook remains negative, so the recent lows could be broken before a bottom is in place. I would expect more choppy action, with initial support now at $91.50 to $92.
US Dollar
It looks as though my skepticism of the rally in the PowerShares DB US Dollar Index Bullish Fund (UUP) was well founded, as it declined all week.
If we get the expected European Central Bank rate hike in the next week or so, it could push the dollar even lower.
The completion of the continuation pattern discussed last time could push UUP to the $80.60 area. There is key support now at $21.06.
Gold
The SPDR Gold Trust (GLD) tried to stabilize last week after breaking the support (line d) the previous week. The weak close Friday suggests more selling early this week.
The next support sits in the $144 to $143 area, and a drop below the May lows at $142.55 would signal a decline to the converging Fibonacci targets in the $140.70 to $140.80 area.
Resistance is now strong in the $148 area.
Silver
The iShares Silver Trust (SLV) is back to the May lows in the $32 area. The overall pattern is negative, and a convincing drop below these lows could trigger a sharp move below $30.
There is first resistance for SLV at $34.18, but a close above the resistance at $35.85 is needed to stabilize the chart.
The Week Ahead
The technical indicators went from bottoming to strong new buy signals by the close of the week. The rush to get back into stocks on Friday suggests we are likely close to a short-term top.
The major averages are trading above the upper starc bands, indicating that now is a high-risk time to buy. Though prices can still go higher, typically the market will either move sideways for a few days or pull back.
The most likely type of correction is one that gives very few investors or traders an opportunity to buy. That could mean we will see a sharp overnight sell-off in the futures. A one- or two-day pullback could take the S&P 500 back to the 1,312 to 1,3,18 area, or $130.70 to $132 in the SPY.
Of course, a deeper, longer correction is also possible—but in either case, it should set up a good buying opportunity for a test of the May highs.
For more on the starc bands, read my recent post here.


