Major U.S. stock market indices continue to track historic seasonal patterns and the historical seasonal pattern for Pre-Election Years quite closely this year and that suggests it is likely to continue to do so, explains seasonal trading expert Jeffrey Hirsch, editor of Stock Trader's Almanac.
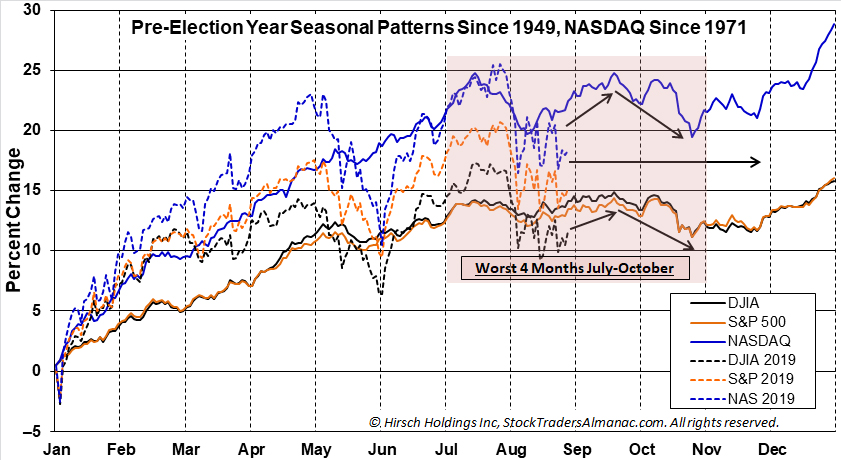
The Pre-Election Year Seasonal Patterns clearly illustrates that despite somewhat greater amplitude DJIA, S&P 500 and NASDAQ have been following the seasonal trend this year -- which had been forecasting an upward trajectory through mid-September before another reversal into late-October.
Our chart of Pre-Election Year Seasonal Patterns (below) overlaid with 2019 to date highlights the amplitude of August 2019 price swings as well as how closely market price action this year has tracked the historical trend and pattern. This suggests 2019 will continue to move in synch with the seasonal moves depicted on the chart.


The last week of the September is the treacherous "Week After Q3 Triple Witching" — down 23 of the last 29 years for the S&P 500. Then the market tends to have a downward bias until late October.
Indeed, October could likely see a retest of 2815 with the 2725 support level that was held in June also being in play. Stick to the drill and wait for our Best Six Months Seasonal MACD Buy Signal before jumping back in with both feet.
For 2020, we could easily join the throng of skeptics and bears that are forecasting recession and a down market for 2020 and stoke investor’s fears, but we have three main observations that have guided us toward a more bullish outlook for Election Year 2020.
1. The Power of Incumbency
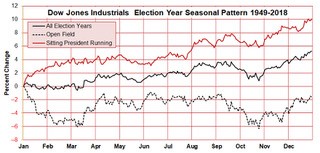
The stock market has performed much better in election years when a sitting president is running for reelection. Since 1949 the Dow is up 10.1% in election years when a sitting president is running for reelection vs. 5.3% in all election years and –1.6% in election years with an open field and no incumbent commander-in-chief running for a second term.
2. Fiscal and Monetary Policy Synchronicity
After several years of conflicting policy the Federal Reserve and the U.S. Federal government are finally getting in synch. Interest rates are historically low and the Fed is on the brink of lowering rates at the same time as fiscal policy has been lowering taxes and increasing spending. These dual pro-growth policies should continue to propel the stock market higher.
3. Recent Pattern of 50% Moves Following Extended Consolidations
An interesting pattern has materialized following the past few market consolidation phases. After bouncing around a base for 2-3 years the DJIA has rallied 50% higher.
Following the 2009 secular bear market low the market rose to the 12,000 level on the Dow in February 2011 and then moved sideways for about 2 years up and down and around 12,000.
Then it took off at the end of Election Year 2012 rising 50% to 18,000 at the end of 2014. DJIA stayed close to 18,000 until just after the election in 2016.
Then it jumped up another 50% near 27,000 in January 2018. Until this month DJIA has been unable to breakthrough 27,000. If this pattern continues, the next 50% move higher can be expected to gain momentum in 2020.
These gains will of course not come without pause and correction. The world stage will continue to feature some challenging geopolitical, diplomatic, trade-related and economic storylines. U.S. presidential campaign politics will increasingly focus on domestic political disputes, standoffs and unfinished business.
But when all is said and done we expect 2020 to be an up year based on the historical patterns and cycles and current favorable policies, relatively healthy economics, a dovish Fed and positive market behavior.


