Perry Kaufman, of KaufmanSignals.com, highlights how and when to use volume as a trading tool by defining its rules and citing examples of its use in stocks, ETFs, and futures, however, he also warns that—like other tools—it’s not always effective due to the erratic nature of volume.
An easy way to add value to your trading decisions is by using volume. Yes, volume is erratic. The old (and probably current) interpretation of volume—which is that higher volume confirms direction and lower volume says the price move is false—should be easy to use…but it’s not. In addition, it’s not always true.
As with most generalizations, it is usually true, but often not true at the most important times. It’s the same as using some other well-worn tools, such as value-at-risk (VaR). It works except when you need it most.
When you think that a trading tool has value but it’s too erratic or complicated, then the best approach is to use the simplest case or to find one pattern that works consistently. It turns out that a volume spike is the simplest example.
The Volume Spike
By isolating the simplest example of volume—the volume spike—we have a good chance of predicting the price movements for the next few days. The price movement following a spike is going to be a reversal of the current direction; therefore, it’s a mean-reverting trade. Because we’re only talking about a 5-day trade, at most, it’s going to be important that you evaluate these trading opportunities daily and track them.
A volume spike is any day that the volume is at least twice the normal volume. If you define the spike as larger than twice the normal volume, then you get fewer examples and fewer opportunities to trade. If you go much lower than twice, then there are too many possibilities and many of them are simply price noise with no predictable outcome.
Defining the Trading Rules
Anyone can find these trades using a simple stock scanner and a few programmable rules. Volume spikes don’t occur often, so you don’t want to be looking for these by hand.
- Calculate normal volume as the 60-day average volume.
- Find the price direction of the past five days. If today’s price is greater than the price five days ago, then the direction is up.
- To enter a trade, today’s volume must be at least twice the normal volume for stocks and ETFs and 2.5 times the normal volume for futures.
- Enter on the close of the day showing a volume spike. If the price direction is up, then enter a Short sale, and if the price direction is down, then Buy.
- Hold the trade for no more than five days.
- If you get another valid signal within the five days, reset the count to 1 and continue holding the trade.
- Do not enter any stock with a share price under $10.
- Your position size is a fixed investment of, for example, $10,000, divided by the price of the stock. All trades in all stocks must use the same investment allocation; therefore, they all have about the same risk.
One Tricky Part
There is always something a bit more complicated and it’s how you use normal volume. Often, before a spike, there are one or two days of higher volume. If we compare today’s volume against yesterday’s, then we can be chasing our tail. So we compare today’s volume against the 60-day average volume, lagged 30 days. By ignoring the most recent 30 days, we get much cleaner trading signals.
Tesla Examples
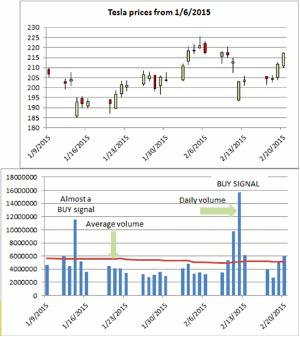
As an example, the charts below show Tesla (TSLA) price (upper chart) and volume (lower chart) beginning January 9, 2015. The 60-day average volume is shown as a red line on the lower chart. The price makes a low on January 14 indicating that the trend is down, but the volume is only 1.9 times the average volume, so there is no buy signal. On February 12, the volume spikes again at 2.5 times the average volume, and the 5-day direction is down, giving a valid buy signal. In both cases, the price reverses immediately after the buy signals and the trades are profitable. For these examples, the first day after the signal was the most profitable, but the fourth day tends to post the best cumulative trade gains for a large sample of stocks.
NEXT PAGE: What’s the Advantage of Mean Reversion and Volume Trading?
|pagebreak|Results
To shortcut the process, we recognize that the stock market has an upwards bias, so the results of shorting stocks using this method is generally a breakeven, net of an $8 per trade cost. Short sale trades are best when held for only three days, reflecting the tendency for prices to rebound quickly.
Because of the upward bias in stocks—and the current bull market—the longer you hold a long position, the more likely you’ll keep increasing your profits. We need to be sure we’re creating alpha by generating profits greater than the upward bias.
Using 275 stocks selected for high liquidity and high volatility, results show an average gain over 14 years of $2,508 per stock, each with an average of 36 trades. If each trade is held for five days, the system is in the market only 5% of the time. The average annualize return is 0.577%, which would be equivalent to 11.55% if it were constantly in the market. On the other hand, we avoid most price shocks and we can invest the unused funds elsewhere.
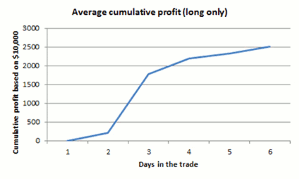
The chart below shows the average pattern of returns over the five days. Note that the largest gains are on day 3 and the second largest on day 4, although all days show some average gain.
The Best Stocks
In tests starting from January 2000, considering long positions only, 66% of the 275 stocks were profitable. With both long and short sales, that drops to 56%. Still, it shows profitability on both sides.
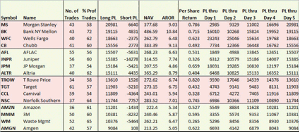
Some stocks are always better than others. The table below is a selection of some of the best results. It may be interesting that financial institutions are near the top. The five columns on the right give the pattern of performance over the five days following the trade entry.
Current Trades
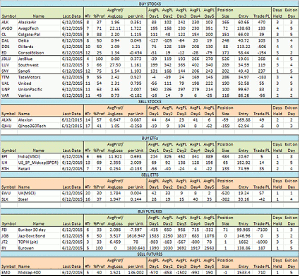
The table below shows current trading signals for stocks, ETFs, and futures, as of the close of Friday, June 12. In each group there are more buy signals than short sales. The meanings of the columns are:
- The stock symbol and name
- The date of the last data available (some world futures may be closed)
- History statistics: Number of trades, percentage of profitable trades, average profit to loss ratio, and per unit (share or contract) return.
- Average cumulative return for the five days that we track the trade.
- Current trade information: Position size, entry price, current trade profit, or loss.
- Trade status: Days since trade was entered, day on which trade should be exited.
The positions size is calculated the same way for each stock, the same investment amount ($10,000) divided by the share price, as long as it is about $10. Stocks trading below $10 tend to have erratic behavior. Futures are calculated as $25,000 divided by the dollar value of the 20-day average true range. This assumes you will have sufficient reserves in addition. You can scale any of the positions size up or down based on your investment, but you should always use the same investment size for calculating your position size.
Advantage of Mean Reversion and Volume Trading
Although this method favors the long side, it enters while prices are going down; therefore, it is classified as a mean reversion trade. It only has a few trades each year, but very good returns. More importantly, it uses volume to trigger the event, which adds another dimension to your trading.
Pay attention to the Short Sales as well. Used in combination with a trend strategy, the high-volume shorts can provide a hedge at key turning points. This can save a considerable amount of unrealized profits, while also lower your trading risk.
By Perry Kaufman, Founder and Editor, KaufmanSignals.com


