In a follow-up to yesterday’s post, CoachShane of NetPicks.com, shows how confluence can not only help you pinpoint an entry point, but also a profitable exit.
In my previous post, I talked about confluence in terms of looking for trading setups.
In this post, I want to go over objective areas to target for your exits. You’d be surprised that many people once in a trade have no idea how to exit!
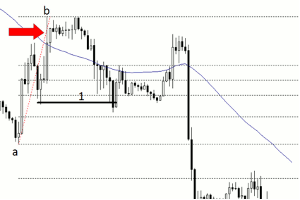
In the first chart, we are going to cover the exit for the first trade from the previous article.
The red arrow indicates the area that we looked for in advance of the price returning to that area. Price breaks lower but where to exit?
a is the low of the original move while b is the completion. A simple Fibonacci retracement shows that the 61.8% level lines up with a zone where price was rejected from (see black line). That move down is about 70 pips from the bottom of the trade zone. You may have made more or less depending on how you enter that trade. The point, though, is a combination of Fibonacci and a support area gave you an objective area to exit. As an added point, that level also coincides with the 127% fib so either the extension tool or the retracement tool gives you the same area.
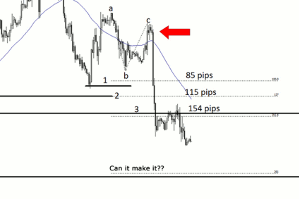
The next chart is the second trade area and this one rocketed down!
Here, we simply used the a-b-c move to give us Fibonacci expansion levels and the red arrow is where the trade originates from.
Line 1 has its zone at a level where price was once supported and lines up with the 100% extension area. If you were reading price action, there is really no reason to exit right at the level as price sliced through it like butter.
Line 2 is the 127% level but to the left, it just lines up with a cluster of trading activity but neither a support or resistance level.
Line 3 lines up with the 161% level plus lines up with a support zone to the left. Although price sliced this level, it started to find some balance in that area. Here is either a great place to take some profit, all profit, or lock in profit.
The can-it-make-it level is interesting. It is the 261% level and also lines up with the origin of a 413 pip move to the upside.
If you were in this trade, you may want to do some higher timeframe analysis to see where you are in the bigger picture considering that an uptrend is still intact although weakening.
Hope you can see how a confluence of factors (this example using simple fibs and s/r zones) can give you objectivity in your trading when looking to not only enter, but exit your trades.
By CoachShane, Contributor, NetPicks.com


