Most traders are aware of the markets’ seasonal patterns and know how they can impact their trades. As we start the new year, Alan Bush of Archer Financial Services reviews a trio of January indicators.
The First Trading Day in January Indicator
The first of the three widely followed January indicators is the "First trading day of the new year indicator." Since the early 1970s, a big advance on the first day of trading in January has been a very bullish indicator for the rest of the year's trade. History has shown that anytime the S&P 500 index has advanced about 1% or more on the first trading day of the new year, the index was able to close higher for the year approximately 85% of the time.
The First Five Trading Days in January Indicator
The second of the January indicators is the "First Five Trading Days in January Indicator." This indicator is based on the price change for the first five trading days in January. The price direction during the first five trading days in January often determines the trend for the balance of the year. According to The Stock Trader's Almanac, "The last 39 first five up trading days of the new year were followed by advances for the rest of the year 33 times, which is an 84.6% accuracy rate. The average gain has been 13.6%.
The Full Month of January Indicator
History has shown that there is a tendency for an up January to be followed by full year gains for the broad stock market indexes. The third January indicator is "As January goes in the stock market, so goes the rest of the year." Of the three January indicators, it is the price direction for the entire month that is the most widely followed, but not necessarily the most accurate. This indicator tends to be relatively reliable when it flashes buy signals, but has a less than stellar record when it generates a sell signal. If the S&P 500 registers a positive return at the end of January it is very likely that there will be follow through gains for the balance of the year. However, if would be a negative signal, suggesting a down year, if there is a decline in the S&P 500.
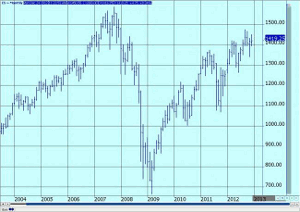
S&P 500 Futures - Monthly Continuation

Chart provided by APEX
Click to Enlarge
The "Trifecta" of January Seasonal Indicators
If the first trading day in January indicator and the first five days in January indicator gives the same signal, we will have to wait until the end the month for the third of the January seasonal indicators to provide a possible "trifecta" of January seasonal signals.
It would be a very bullish sign if all three of the January indications flashed buy signals. By the same token, it would be a bearish indication for the market if all three of indicators were negative.
By Alan Bush of Archer Financial Services


