Trader and educator Jeffrey Kennedy shows real market examples that illustrate how proper Elliott wave analysis can help traders accurately identify and trade important turning points in any market.
Unlike "fundamental" analysis, the Elliott wave approach to market forecasting is objective. That is, Elliotticians work with a set number of Elliott wave structures in price charts. So, rather than guessing about how this or that news outcome "impacts" a market’s price, you get an unambiguous, and objective, opinion.
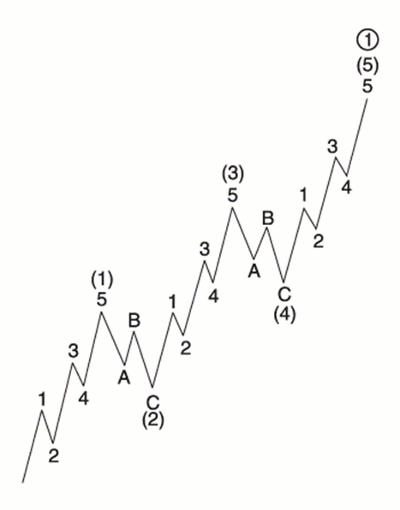
When it comes to structure, Elliott wave analysis identifies one main structure of market progress: the five-wave form. Here, the classic Wall Street bestseller Elliott Wave Principle—Key to Market Behavior, provides the following diagram and description of the pattern:
"Three of these waves, which are labeled 1, 3, and 5, actually effect the directional movement. [They also subdivide into five smaller waves of lesser and lesser degree, and so on]. They are separated by two countertrend interruptions, which are labeled 2 and 4. [These subdivide into corrective wave patterns of lesser and lesser degree, and so on]."
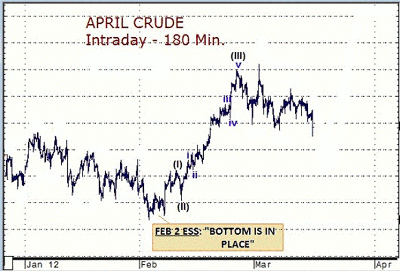
Now, let’s take it back to "black gold," or oil. The chart below comes from the viewpoint of Elliott wave intraday analysis of crude oil. It clearly shows you that the market’s huge February rally unfolded as a third wave.
But that’s not the best part. The most valuable aspect of Elliott wave analysis is its ability to identify a wave structure early in its development. So, if you can "name that shape," you can be there at the beginning of a major trend change.
Case in point: On February 2, right as crude oil was preparing to rally, Elliott wave analysis opened the bullish door with this insight:
“The deep retrenchment is pressuring the count, but Elliott wave traders continue to suspect that the next sustained move will be to the upside.
Trade above Tuesday’s high… should be a good hint that a bottom is in place and that the advance is underway."
It’s a great example of how counting Elliott waves can give you deep insight into the tops and bottoms of any market.
See related: Merits of Elliott Wave Analysis
When you are watching a pattern develop on a chart, how can you be sure that your wave count is correct? The Elliott wave principle offers rules and guidelines that you can use to add confidence to your wave count.
NEXT: 3 Types of Wave Channels to Watch
|pagebreak|Base Channel
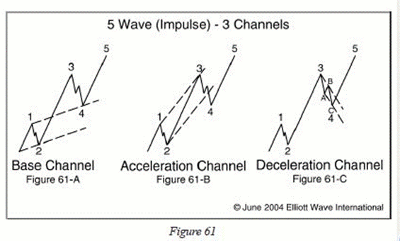
The figure below shows three separate five-wave patterns with three different channels drawn: the base channel, the acceleration channel, and the deceleration channel.
Base Channel
The base channel contains the origin of wave one, the end of wave two, and the extreme of wave one (below). Of the three channels, the base channel is most important, because it defines the trend.
Acceleration Channel
The acceleration channel encompasses wave three. Use the extreme of wave one, the most recent high, and the bottom of wave two to draw this channel. As wave three develops, you’ll need to redraw the acceleration channel to accommodate new highs.
Once prices break through the lower boundary line of the acceleration channel, we have confirmation that wave three is over and that wave four is unfolding. I have noticed that wave four will often end near the upper boundary line of the base channel or moderately within the parallel lines. If prices break through the lower boundary line of the base channel decisively, it means the trend is down, and you need to draw new channels.
Deceleration Channel
The deceleration channel contains wave four. To draw the deceleration channel, simply connect the extremes of wave three and wave B with a trend line. Take a parallel of this line, and place it on the extreme of wave A.
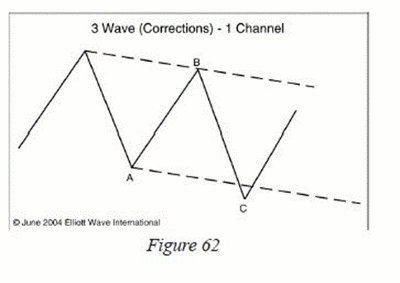
As I mentioned before, price action that stays within one price channel is often corrective. When prices break through the upper boundary line of this channel, you can expect a fifth-wave rally next.
In a nutshell, prices need to break out of the base channel to confirm the trend. Movement out of the acceleration channel confirms that wave four is in force, and penetration of the deceleration channel lines signals that wave five is underway.
As long as prices stay within the base channel, we can safely consider the price action corrective.
Over the years, I’ve discovered that most corrective wave patterns stay within one price channel (above). Only after prices have moved through the upper or lower boundary lines of this channel is an impulsive wave count suitable, which brings us to the acceleration channel.
By Jeffrey Kennedy of ElliottWave.com
Since 1999, Jeffrey Kennedy has produced dozens of Trader’s Classroom lessons exclusively for his subscribers. Now you can get the “best of the best" in these 14 lessons that offer the most critical information every trader should know. Download the FREE 45-page eBook here.


