This recent failure of a high-profile indicator comes as a harsh reminder that no indicator is foolproof, and traders should instead look to multiple indicators to confirm signals and improve their chances.
The problem with following one indicator when trading is that it is just that: an indicator. It is not a certainty or a fact. It may even work 99 out of 100 times, but that does not mean it will work for you in any particular instance.
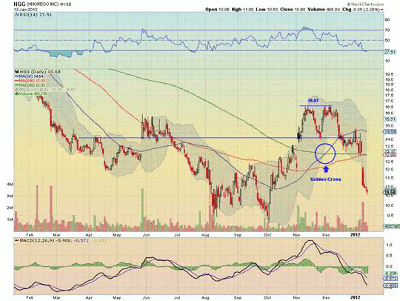
Look at the example of the “golden cross.” This pattern has been highly touted lately, as it is showing up on a lot of charts and is a large-scale bullish indicator. It happens when the 50-day simple moving average (SMA) crosses up through the 200-day SMA.
But as the below chart of HHGregg (HHG) shows, it can be meaningless, too…or worse. This stock was at its high at the time of the cross, and since then, it has dropped over 35%; hardly a bullish move.
Now, I am not advocating that the golden cross is useless or not helpful. Instead, it should be one of many tools in your technical analysis tool shed.
See related: The Year’s Most Reliable Indicator
For this stock, there were other indicators that would have created a mosaic that could have prevented you from buying the cross. It was at resistance, the moving average convergence divergence (MACD) indicator was still negative, and the relative strength index (RSI) had just made a lower high.
I would have advocated a long set-up as it approached $16.61 again, but only on a breakout to a new high.
There were also signs that pointed to the rise to $16.61 when the MACD crossed positive in October with the RSI moving above 60 into bullish territory and the 50-day SMA shifting to sloping upward as it made a new high over the September high. These signals could have failed as well, as they were no guarantee.
The bottom line is for traders to expand their tool kit, build a mosaic, and then follow price.
See also: Trader Reveals His “Holy Grail” Indicator
By Greg Harmon of Dragonfly Capital


