Joey Fundora of Downtowntrader.com explains why he thinks the world’s most popular Internet stock could be gearing up for a multi-year run targeting much higher prices.
I was browsing through some long-term charts and was surprised at how good the weekly and monthly charts for Google, Inc. (GOOG) look.
I never trade GOOG because, quite frankly, I think it’s boring, takes up too much capital, and doesn’t really move very much on a percentage basis. However, I am a huge fan and user of Google products. Android is huge, I’ve been a Gmail user since inception, and love the whole Google Docs idea as well.
After I reviewed the charts for GOOG, I looked through recent Tweets for community thoughts and maybe to find some good articles or posts about the stock. Because I am more excited about the long-term charts than the near-term daily charts (which don’t look shabby, either), I find it comforting that Howard (Lindzon) is thinking about this stock from a “story” perspective, which would lend itself to a longer-term play.
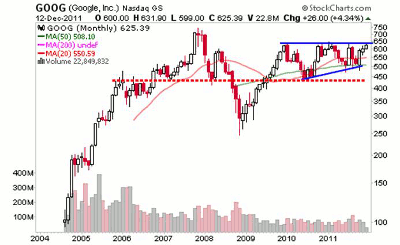
Looking more closely at the charts, GOOG is really not too far from its all-time highs after spending several years consolidating. GOOG is definitely not the exciting startup it once was, and it takes much more to move the stock than it used to.
That being said, overall, the consolidation of the past couple years has been very orderly when looked at from this perspective. The $630-$640 level has been a clear level of contention, and would be the key area to focus on.
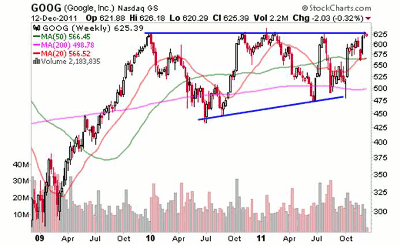
Drilling down to the weekly chart, it is clear how the $630′s have sparked some sharp reversals. However, GOOG has been setting progressively higher lows and returned to the top of the base very quickly after being rebuffed in November. Once again, the consolidation has been very orderly when looked at from this longer-term perspective.
NEXT: Cloudier Picture on Google Daily Charts
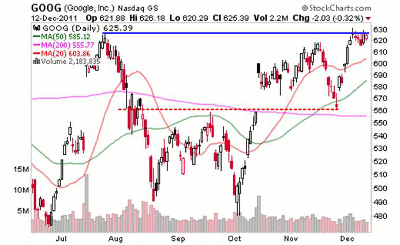
|pagebreak|The daily chart is where GOOG starts to get a little messy, although the overall pattern remains quite constructive. There are a lot of gaps, and without the context of the longer-term charts, it would appear that GOOG was not making any progress.
My initial guess would be that GOOG still needs a little more time before it could seriously assault its long-term resistance, and I would actually prefer a pullback because I would rather buy longer-term positions after short-term weakness.
The $560 level is an area of potential support should it weaken considerably, but the $590-$600 area may also be an area to watch. The 50-day moving average would be in this area, and it also coincides with an unfilled gap left over from a couple of weeks ago.
Buying breakouts in this market has not been very reliable, but it would be hard to ignore any sustained strength above $630. This may signal a multi-year breakout that could lead to much higher prices.
I have no position in GOOG, but will certainly be monitoring it more closely in the coming weeks.
By Joey Fundora, trader and blogger at Downtowntrader.com
Joey Fundora has also been a speaker at The Traders Expo.


