Recent market action in four well-known stocks shows gaps on the charts, which are important technical formations that can greatly influence future price movement in the shares.
Let’s take a look at gaps and fills, which are well-known technical indicators and favorite formations for short-term traders in the first hour after the market open.
A gap is exactly as it sounds: a gap between the data points of a stock’s chart. Often, the daily chart is useful for examining gaps, because there has to be some significant buying or selling pressure that causes a stock to move up or down sharply on the open on a particular day and then not “fill in" that gapped area during that same trading day.
Gaps are often caused by external news events and typically occur on heavy volume.
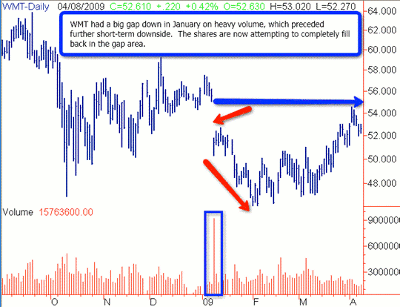
The chart below shows a big gap down in Wal-Mart Stores (WMT), which took place on huge volume. The bearish gap was followed by further short-term downside. The shares did not completely fill in this gap area during the time frame examined. The gap area is now potential resistance to further upside on this chart.
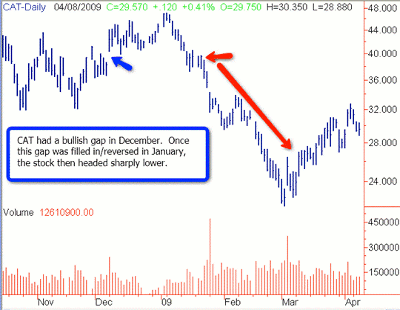
On the chart of Caterpillar (CAT) below, you can see the shares had a bullish upside gap, but when that gap was filled in on the downside about a month later, it preceded a sharp leg down in the stock.
The filling in of gaps often nullifies and sometimes reverses the "power" that a gap has to determine direction.
NEXT: Recent Gap Examples in Mosaic (MOS) and Middleby (MIDD)
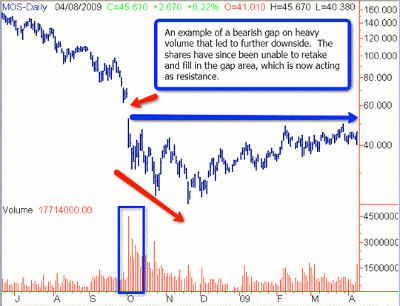
|pagebreak|The following chart of Mosaic (MOS) shows a bearish gap on heavy volume. The gap down was followed by further downside. Since then, the shares have been unable to overtake the lower gap area, which is now acting as resistance.
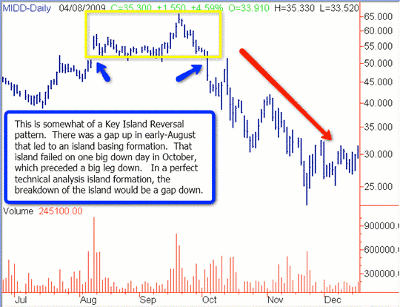
The following chart of Middleby (MIDD) shows a gap up that created what is called an "island." The stock consolidated above the gap zone into an island, then breached the gap zone. Subsequently, the shares declined heavily. This is often called an "island reversal."
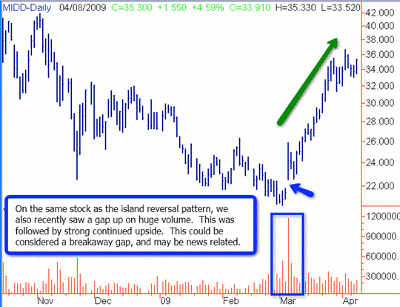
The next chart, also of MIDD, shows a recent gap up on heavy volume. This was followed by continued strong upside in the shares. This could be considered a "breakaway gap."
Gaps, fills, and islands are useful parts of technical analysis. Significant gaps up and down are often important signposts in a stock’s chart. Whether a gap is filled in quickly—or filled in at all—is significant as well. Especially on the daily charts, keep an eye peeled for gaps and the subsequent action in the stock.
See video: The Best Gap Trades on the Market
By Moby Waller of BigTrends.com

