The Average Directional Indicator, commonly referred to as ADX, is a useful technical measure of the buying or selling pressure on a particular equity or index.
With the big downside market volatility we've seen recently, we've been looking at our sentiment indicators, such as the put/call ratios, the Volatility Index (VIX), and our Rydex ratio to gauge the market's level of panic. Today, I'd like to take a look at a purely technical chart indicator called ADX, which is Welles Wilder's Directional Movement Index.
See video: How to Trade Using the ADX Indicator
ADX is typically used in conjunction with Directional Movement Indices, or DMI. While I don't want to get into the formulas here, essentially, DMI is a measure of buying pressure or selling pressure on a stock or index, as indicated by a session's highs or lows, respectively.
In other words, we are less concerned with the closing price and more concerned with the high of the day and how today's high compares to the previous day's high. A rising DMI line would indicate higher highs each day, and of course, that is bullish. This is called DMIplus.
The same is true for selling pressure, or daily lows. This DMIminus measures today's low in comparison to yesterday's low. Consecutively lower lows are of course bearish, and the result would be a rising DMIminus line.
And the ADX? The ADX is the difference between the DMIplus and DMIminus. A high ADX number indicates a strong trend because DMIplus would be significantly higher or significantly lower than DMIminus. Likewise, a lower ADX number would indicate a very minimal difference between DMIplus and DMIminus, and therefore, a weak trend.
Confused yet? Don't be. The calculations and formulas are typically done for you, and ADX analysis is better done with a chart rather than a written description. The charts below will show you the recent ADX/DMI information for the S&P 500.
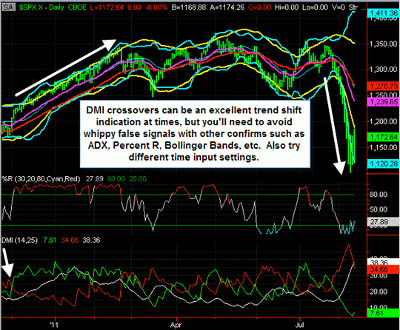
The green line is the DMIplus, red line is the DMIminus, and the white line is ADX. There are different trading methods used with these indicators, but the most common are crossovers of plus/minus (in either direction), crossovers of plus or minus with ADX, ADX strength of movement and direction, and DMI width difference (between the plus and minus, for example).
One thing that jumps out on the daily S&P 500 (SPX) chart below in relation to DMI is that the two biggest trend moves we've seen this year were both signaled by DMI crossovers.
There was a bullish crossover in December 2010 (and another in October 2010) that remained in effect for months with a steady market uptrend. Recently, in late July, there was a bearish crossover (with these standard ADX/DMI settings) that preceded the big market selloff.
Then there are a number of less-effective crossovers using this method between February and July. This is where other screens and trading methods need to be incorporated with ADX/DMI to avoid too many false readings and whippiness.
Here is an SPX daily chart with the ADX/DMI indicator:
NEXT: See ADX Applied on the SPX Weekly Chart
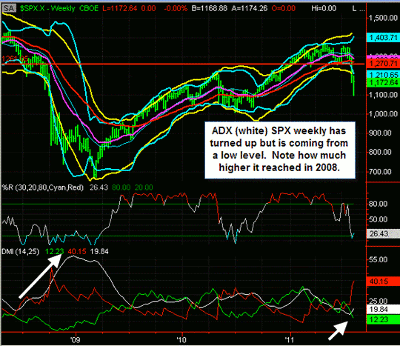
|pagebreak|Stepping back to the weekly SPX chart below, another major use of ADX can be seen:
ADX (in white) is designed to show the strength of trend, regardless of direction. Knowing that a trend is in effect and the strength of it is an essential factor to successful directional-based trading, ADX can be a useful tool.
On the weekly chart below, we can look at ADX/DMI among other indicators to compare the recent market selloff to the huge 2008 selloff and other downturns. We want to ascertain whether the recent move has more downside to go, or whether we will consolidate in a volatile range, or even rally back higher quickly.
Note the huge ADX upward move in 2008. The ADX now is coming from a fairly low area and we're not yet seeing a huge strength of trend on this weekly basis. That is something to keep an eye on in the weeks ahead.
ADX and DMI are technical indicators found in most every charting platform these days, and they are useful for a variety of methods including strength of trend and trend direction changes. Remember that with many trading platforms, you can also change the time frame (size, length) inputs to modify and optimize an indicator to fit your personal time frame trading systems for various securities.
By Price Headley of BigTrends.com


