Looking at the percentage of stocks above or below their 200-day moving averages is an often-overlooked, yet reliable method for identifying when the market’s overall trend is ready to reverse.
Traders of all types are looking for significant insights regarding the condition of the stock market. The market averages may be the simplest indicators, but the averages don't present any information on extremes.
Ideally, some tool or indicator that provides a measure of historical extreme is useful for becoming prepared for a turning point in the trend. The number of stocks under—or over—the 200-day moving average (MA) is a good indicator that is overlooked by too many traders.
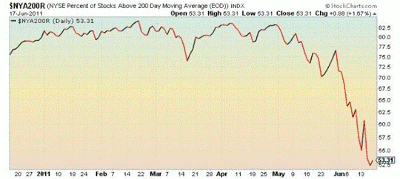
When conditions have been bullish for some time, more than 80% of all NYSE-traded stocks will trade above their long-term trend lines. In February 2011, that number peaked at nearly 84% and remained above 80% until early May.
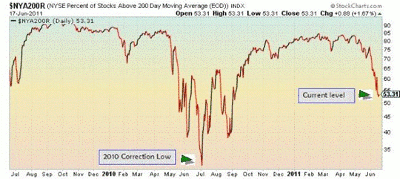
Now, you can see from the chart below that it has since plummeted through June to just above 50%, but it's not yet at extremely low levels to be associated with market bottoms.
During the correction in 2010, the number of stocks above their 200-day MA dropped to nearly 30% in early July. The market did not bottom out, however, until August 31.
The "flash crash” was in early May when European debt default was an issue—as it still is now with Greece. The deterioration in the early days of the 2010 correction looks similar to the rapid decline we're seeing in June of this year.
Sentiment indicators have deteriorated, but they aren't near the historical extremes that coincide with market bottoms.
Not unlike the mindset of investors at the time of the "flash crash," it doesn't feel like investors have turned into bears. Stocks have logged gigantic gains since early 2009, so a consolidation of some significance would not be out of character for the market at any time.
We monitor the level of stocks above the 200-day moving average—as well as other indicators—on a regular basis.
By Paul Thornton of InvestorBootcampOnline.com


