By Don Pendergast of ChartW59.com
Assuming that you already have a statistically viable trading concept, one that you or another skilled programmer can write in EasyLanguage (TradeStation) format, the next step is to learn how to interpret the backtested output of your strategy in the TradeStation strategy performance report.
Before giving some insights as to the most meaningful stats in the report, let's get a few things straight about what you ultimately want to accomplish with your trading strategy.
Ideal goals for any trading system are:
- A smooth, steadily rising equity curve
- A modest profit-to-maximum-drawdown ratio
- A strong profit factor (1.5:1 or better for intraday systems and at least 2:1 or better for swing and/or position trade systems)
- A very low risk-of-ruin factor
- The maximum number of consecutive losers and/or maximum drawdown factor is well within your psychological comfort zone
- More than enough trades to confirm that the strategy is statistically viable—in both backtested and “walk-forward” (paper traded) mode. So realistically, you should test the strategy on at least a couple years of intraday data and perhaps as much as 20 to 40 years for daily data for longer-term systems using a variety of in-sample and out-sample mixes to confirm that the system can produce profits in many kinds of market phases
- Last but not least, you want to see the system produce profits—and plenty of them—being sure to use realistic amounts for both commissions and slippage in your testing procedures
These are some of the major issues you'll need to address before actually trading your new system with real money.
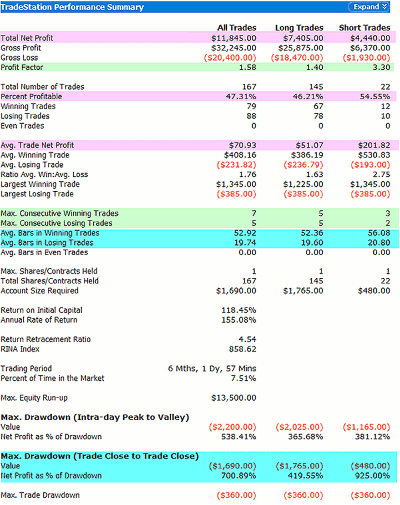
Take a look at the graphic below:
There are dozens of useful statistics listed in the various tabs of the TradeStation strategy performance report. Highlighted here are some of the more important ones that intraday trend-following-system developers will want to focus on.
That said, look at the graphic above for an intraday e-mini stock index futures trading system that has shown strong performance in both backtested and “walk-forward,” real-life trading. This is a recent backtest report for the system covering six months of hypothetical trading and is calculated using per- contract commission and slippage figures of $2.50 and $10, respectively.
Here are the high points:
- The system made almost $12,000 in a six-month period across 167 trades
- It made more money on the long side than the short side, mostly because of the tremendous uptrend in the US stock indexes since last summer. However, it still performed very well in and of itself when going short
- It wins about 47% of the time (are you getting nervous?)
- The profit factor is 1.58, a good number for a daytrading system
- It had seven winners in a row at one point and also had five losers in a row at another point during the same test period
- The system stays in winning trades nearly two-and-a-half times longer than it does in losing trades
- It has an annual rate of return (return on initial margin, that is) of 155%. (Passbook savings account, anyone?)
- The maximum closed trade drawdown came in at $1,690, meaning that the net profit as a percentage of drawdown was better than 700%
Article Continues on Page 2
|pagebreak|Generally speaking, these are very respectable backtest performances for a one-lot e-mini Russell 2000 futures system. While all of the stats in the report are useful, the ones you really want to focus on are the net profit, profit factor, and the ratio of the net profit to maximum close trade drawdown stats. Last but not least, you'll also want to verify that the equity curve is as straight as possible and rising steadily at a nice upward angle. If these four individual factors are all in good shape, chances are the rest of the stats in the report will also be very much to your liking as well.
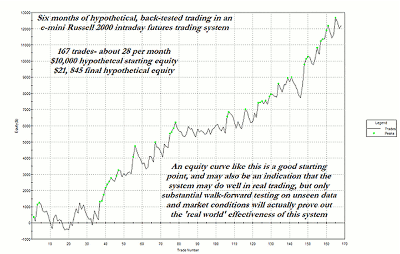
Figure 2 shows the equity curve for this particular backtest. Overall, this is the kind of equity curve you wish to see—not too much time spent going sideways, and the drawdowns are modest. The time between successive equity curve highs is minimal as well (see the green dots on the chart; those are the new peak values in the curve).
In backtest mode, the system does just fine. What's next? Now the fun part begins. You need to run the system in walk-forward mode until you're satisfied that it can and will perform satisfactorily in the future on data and in market conditions it has never dealt with before. You may be horrified to see just how quickly your brand new system falls apart before your eyes as the market tries to tear it apart, moment by moment, tick by tick, trade after trade. Then again, a well-designed system may perform nearly as well in walk-forward mode as it does in backtest mode, and that is what you need to see if you hope to use it in the real world and with real money. Don't even think of skipping this step, as it can prove to be very costly to learn that a system just wasn't up to the job, especially because you failed to perform adequate out-of-sample, walk-forward analysis on it.
Take the time and fully test every system, no matter how long it takes, before deciding to go live with it (or to further refine it or even scrap it). It's worth the wait, no matter what the outcome is.
A key priority for every system developer is to create a strategy that produces as straight an equity curve line as possible. This one is generated from six months of hypothetical backtested trading activity in an intraday stock index futures system. The next step is to test the system in “walk- forward,” or “demo account mode,” to see if the strategy still has real-world merit.
While this little article can't even begin to teach you all you'll need to learn to develop, test, optimize, and actually trade a winning system, at least it can give you a rough guide as to what to focus on as you create your own systems. If, however, I had to reduce the process to a one-sentence summary of the one single-most important goal, it would be this:
"Choose the system that, even in raw, unoptimized form, offers you the straightest, highest-angle-of-attack equity line possible, making sure that the overall profit-to-maximum-drawdown ratio is as large as possible; preferably at least a ratio of 7:1, if not higher."
If you can manage to construct a raw system that offers both of those essential qualities, then you're definitely going in the right direction.
Now you just need to prepare yourself for many more hours of optimization, formatting, head scratching, table pounding, error hunting, and endless fine-tuning, hoping to keep most of your sanity intact during the process.
Once you're trading it with real money (or have real, live subscribers trading it with their own money), you'll also need to be prepared for the unexpected—unexpectedly poor fills, wireless connectivity issues, price gaps, missed trades because of some unknown factor(s), changing market dynamics (a major cause for trading systems going kaput), and on and on. These things don't happen very often, but they can and do make guest appearances at the most inopportune times. You need to be able to deal with situations like this; and in a rational, calm, and focused manner.
Overall, developing your own system is a worthwhile endeavor, but you've got to be willing to put in the time, testing your ideas until you finally discover the 98% of trading ideas that just won't cut it in the real world. It's the 2% of ideas that really shine that make it all worthwhile.
By Don Pendergast of ChartW59.com


