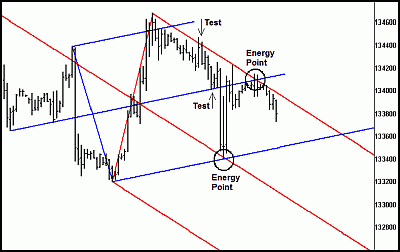
Sometimes I find myself working with a chart with two median line sets that have both been tested, and both have done a good job showing me where price should run out of energy. Let me show you an example of what I mean:
You can see on this chart, both the blue up-sloping median line set and the red down-sloping median line set showed me exactly where price should run out of energy-and indeed, price did run out of energy at those areas. And price was attracted right to the two energy points where the two lines of opposing force met, and price turned on a dime at those areas.
But like all good things in life, both of these lines won't work together forever. Eventually, price will break out of one of these median line sets. When that happens, is it time to break out the eraser and just work with the median line set that still hasn't been violated?
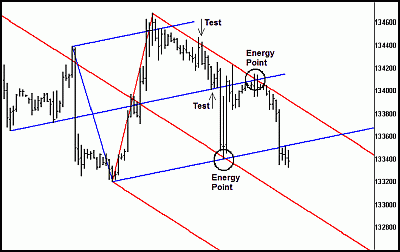
Price clearly made a new low and not only broke below the up-sloping blue lower median line parallel, but it continues to make lower lows and it is showing no sign of climbing back above the blue lower median line parallel. Clearly, the red down-sloping median line set is showing the probable path of price.
Now that the blue median line set has been violated, should I discard it?
More tomorrow in Part 2.
By Timothy Morge
tmorge@sbcglobal.net email me
www.medianline.com
www.marketgeometry.com


