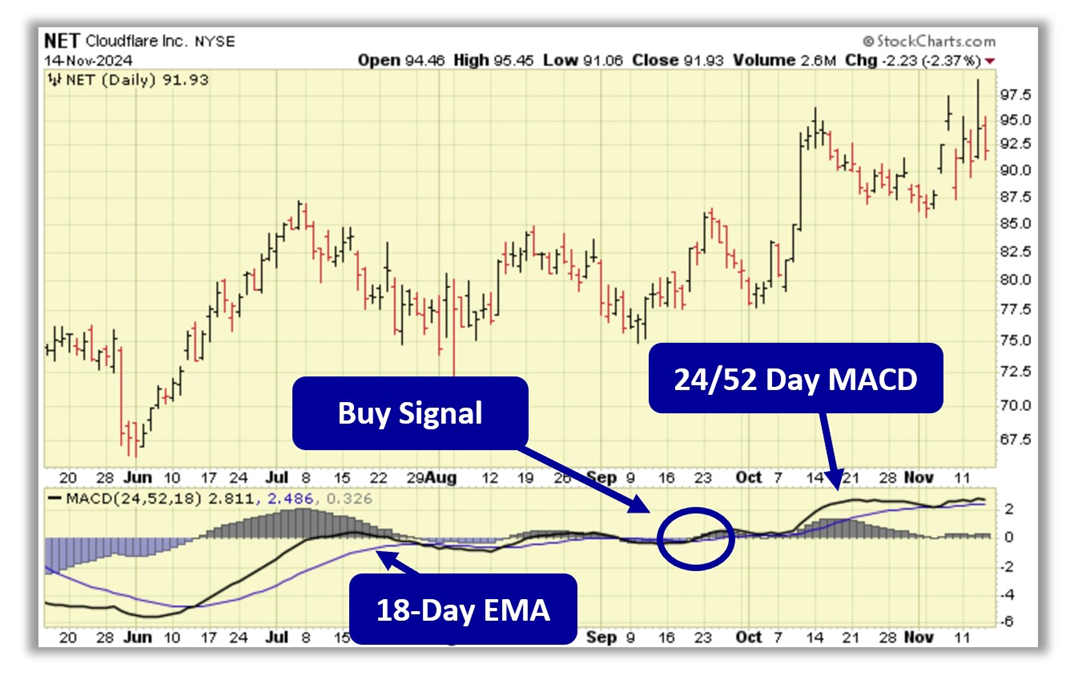
For today’s Trade of the Day piece, we will be looking at a Moving Average Convergence/Divergence (MACD) chart for Cloudflare, Inc. (NET). Since NET’s bullish run is likely to continue, the stock should be purchased, notes Chuck Hughes, co-founder of Hughes Optioneering.
Cloudflare operates as a cloud services provider that delivers a range of services to businesses worldwide. The company provides an integrated cloud-based security solution to secure a range of platforms, including public cloud, private cloud, on-premise, software-as-a-service applications, and IoT devices.
The NET daily price chart below shows that NET is in a price uptrend as the 24/52-day MACD line (black line) is above the 18-Day EMA (purple line). The Moving Average Convergence/Divergence chart is shown below the daily price chart.

MACD uses moving averages to create a momentum indicator by subtracting the longer-term moving average from the shorter-term moving average. The MACD is calculated by subtracting a stock’s longer term 52-Day Exponential Moving Average (EMA) from its shorter term 24-Day EMA. This creates the MACD line.
The 18-Day EMA line functions as a buy/sell ‘trigger’. When the 24/52 Day MACD line crosses above the 18-Day EMA line, it indicates positive momentum and higher prices for the stock. When the 24/52 Day MACD line crosses below the 18-Day EMA, it indicates negative momentum and lower prices for the stock. MACD is more of a leading indicator than a moving average crossover which tends to lag price movement.
Also included in a MACD chart is the histogram bar graph. This portion of the chart helps to illustrate the distance between the 24/52 Day MACD and the 18-Day EMA. When a crossover initially occurs, the histogram’s bar will be near flat as the two indicator lines have converged. As the lines begin to separate, the bars grow in height, indicating a widening gap and acceleration for the stock’s momentum.
When the histogram’s bars begin to shrink, this indicates a narrowing of the gap between the 24/52 Day MACD and the 18-Day EMA and a slowing of the stock’s momentum. When the gap between the two indicators begins to narrow, this typically indicates a crossover of the indicator lines could happen soon.
As long as the 24/52 Day MACD line remains above the 18-Day EMA, the stock is more likely to keep trading at new highs in the coming days and weeks. Our initial price target for NET stock is $95 per share.
Recommended Action: Buy NET.


