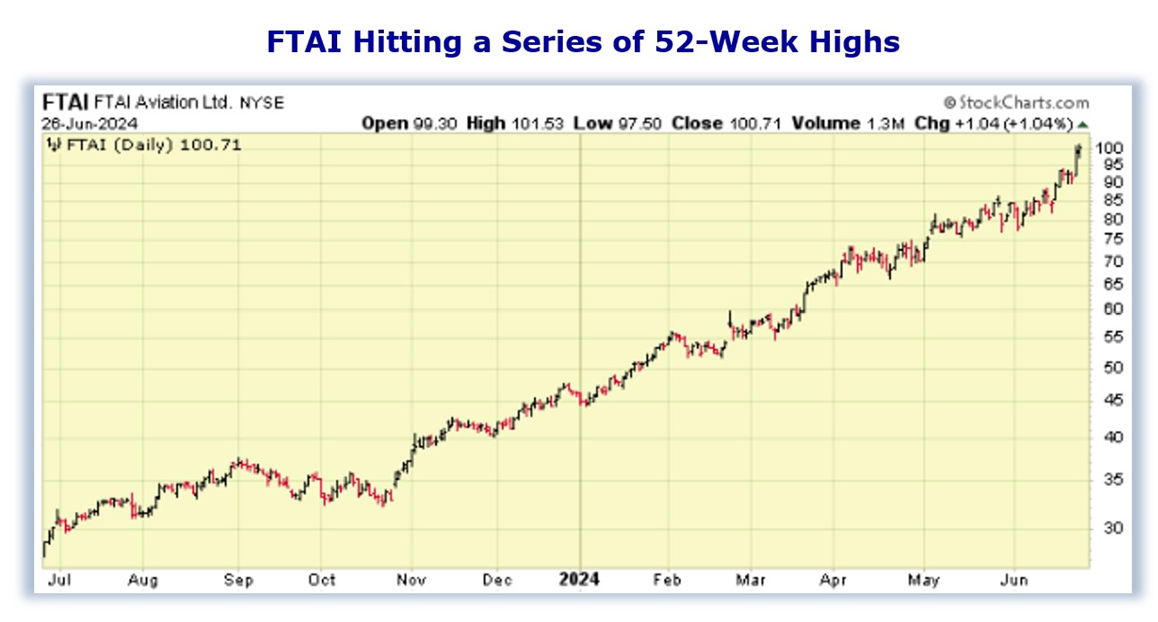
For today’s Trade of the Day we will be looking at a Daily Price chart for FTAI Aviation Ltd. (FTAI). Since FTAI shares have been making a series of new 52-week highs and will likely rally from here, I’ll use the Hughes Optioneering calculator to look at the potential returns for a FTAI call option spread, says Chuck Hughes, co-founder of Hughes Optioneering.
FTAI owns and maintains commercial jet engines, with a focus on CFM56 engines. Its propriety portfolio of products includes The Module Factory and a JV to manufacture engine PMA.
Now, let’s begin to break down the daily price chart, with the price line displayed by an OHLC bar.

The daily price chart shows that FTAI has been hitting new 52-week highs regularly over the past month. The Hughes Optioneering team looks for stocks that are making a series of 52-week highs as this is a good indicator that the stock is in a powerful uptrend. Our initial price target for FTAI stock is $108.91 per share.
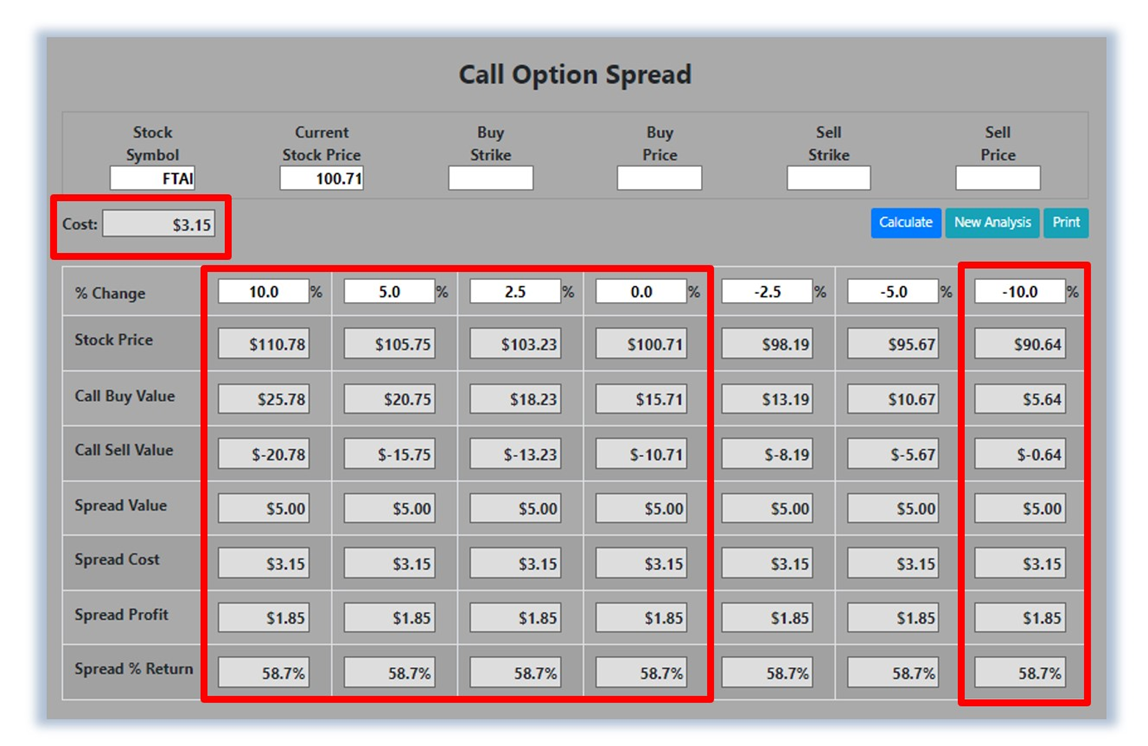
The Call Option Spread Calculator will calculate the profit/loss potential for a call option spread based on the price change of an underlying stock or ETF at option expiration, in this example from a 10% increase to a 10% decrease in FTAI at option expiration.

The goal of this example is to demonstrate the "built in" profit potential for option spreads and the ability of spreads to profit if the underlying stock is up, down, or flat at option expiration. The prices and returns represented were calculated based on the stock and option pricing for FTAI on June 26, 2024, before commissions.
For this option spread, the calculator analysis reveals the cost of the spread is $315 (circled). The maximum risk for an option spread is the cost of the spread. The analysis reveals that if FTAI stock is flat or up at all at expiration, the spread will realize a 58.7% return (circled). And if FTAI stock decreases 10% at option expiration, the option spread would make a 58.7% return (circled).


