
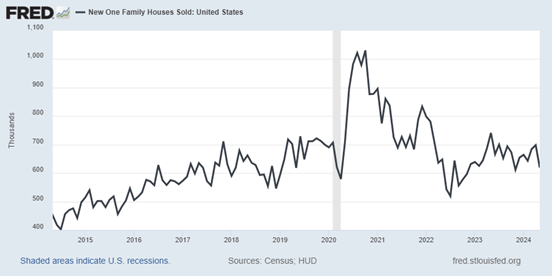
New home sales in May, measuring contract signings of freshly made construction and thus more timely than existing home sales that calculate the number of closings, totaled 619,000. That was 24,000 less than expected. But April was revised up by 64,000 to 698,000, which was the most since July 2023, advises Peter Boockvar, editor of The Boock Report.
I’m not sure why, but there was a drop in new home sales in the Northeast to the least amount since June 2022. These figures include homes that have been finished, are still under construction, or not yet started.
(Editor’s Note: Peter Boockvar is speaking at the 2024 MoneyShow Toronto, which runs Sept. 13-14. Click HERE to register)
Months’ supply rose to 9.3 from 8.1 in April. The number of homes for sale is now at the highest level since January 2008. Remember that Toll Brothers Inc. (TOL) said on their last call that they have increased the amount of spec homes being built.
A cooling of home prices, if the result of this new home supply, would be welcomed by the transaction market for sure. But those long homebuilding stocks should take note. The median home price was little changed year-over-year, down 0.9%. But because of mix, this is very volatile month to month.
Bottom line: Smoothing out the monthly volatility in this data point has the three-month average at 667,000 vs. the six-month average at 660,000 and the 12-month average at 663,000. For perspective, this averaged 685,000 in 2019.
So, the big builders are doing well because they are taking market share and are able to provide incentives to buyers, like a mortgage buydown. The smaller builders are having a more difficult time. Hence, the NAHB builder index is well below 50, both because funding costs are high and because they can’t discount as much for the buyer, who is certainly affordability challenged.


