
For today’s Trade of the Day we will be looking at a daily price chart for Constellation Energy Corp. (CEG). Before breaking down CEG’s daily price chart, let’s first review which products and services are offered by the company, writes Chuck Hughes, co-founder of Hughes Optioneering.
Constellation generates and markets electricity. Its operating segment consists of the Mid-Atlantic, Midwest, New York, ERCOT, and Other Power Regions. The company sells natural gas, renewable energy, and other energy-related products and services.
Now, let’s begin to break down the daily price chart for CEG. Below is a daily price chart with the price line displayed by an OHLC bar. It shows that CEG stock has been hitting new 52-week highs regularly since early May. Simply put, a stock does not just continually hit a series of new 52-week highs unless it is in a very strong bullish trend.
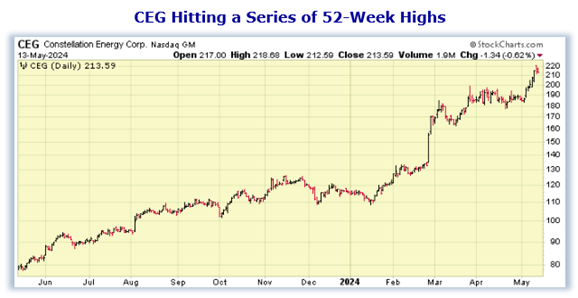
The Hughes Optioneering team looks for stocks that are making a series of 52-week highs as this is a good indicator that the stock is in a powerful uptrend. You see, after a stock makes a series of two or more 52-week highs, the stock typically continues its price uptrend and should be purchased. Our initial price target for CEG stock is 227.95 per share.
Now, since CEG is currently making a series of new 52-week highs and will likely rally from here, let’s use the Hughes Optioneering calculator to look at the potential returns for a CEG call option spread.
The Call Option Spread Calculator will calculate the profit/loss potential for a call option spread based on the price change of the underlying stock/ETF at option expiration – in this example, from a 10% increase to a 10% decrease in CEG stock at option expiration.
The goal of this example is to demonstrate the ‘built in’ profit potential for option spreads and the ability of spreads to profit if the underlying stock is up, down, or flat at option expiration. Out of fairness to our paid option service subscribers we don’t list the option strike prices used in the profit/loss calculation.
The prices and returns represented below were calculated based on the current stock and option pricing for CEG on May 13 before commissions.
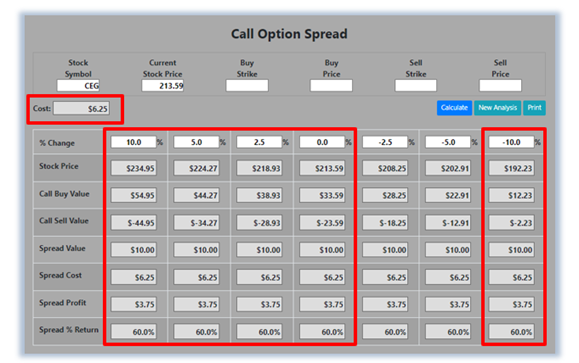
For this option spread, the calculator analysis reveals the cost of the spread is $625 (circled). The maximum risk for an option spread is the cost of the spread. The analysis reveals that if CEG stock is flat or up at all at expiration the spread will realize a 60% return (circled). And if CEG stock decreases 10% at option expiration, the option spread would make a 60% return (circled).
Due to option pricing characteristics, this option spread had a ‘built in’ 60% profit potential when the trade was identified. Option spread trades can result in a higher percentage of winning trades compared to a directional option trade if you can profit when the underlying stock/ETF is up, down, or flat. A higher percentage of winning trades can give you the discipline needed to become a successful trader.


