We used to have a sign in our old office about picking downside targets. It said one thing: don’t do it, asserts Jeffrey Hirsch, seasonal trading specialist and editor of Stock Trader's Almanac.
Several support levels we have highlighted over the past few months have been either violated or are under attack. So even though picking downside targets may be a futile effort, here are some levels we’ve been looking at.
In our May Outlook — Midterm Bottom on the Horizon — we compared the similarities of the market action this year to 1960 and 1970. This disturbing comparison is not abating. Two other comparable bear market years have also come to light. 1962 and 1974: both midterm years with similar chart patterns. In the chart below 1960 was removed since the year held the March low until September and it was an election year.
Like 2022 geopolitics plagued 1962 with Cold War machinations and the Cuban Missile Crisis, but rates, inflation and oil prices were nothing like 2022. 1974 on the other hand had it all: negative Q1 GDP, high inflation, Oil Crisis, and war in the Mideast.
March 2021 Lows
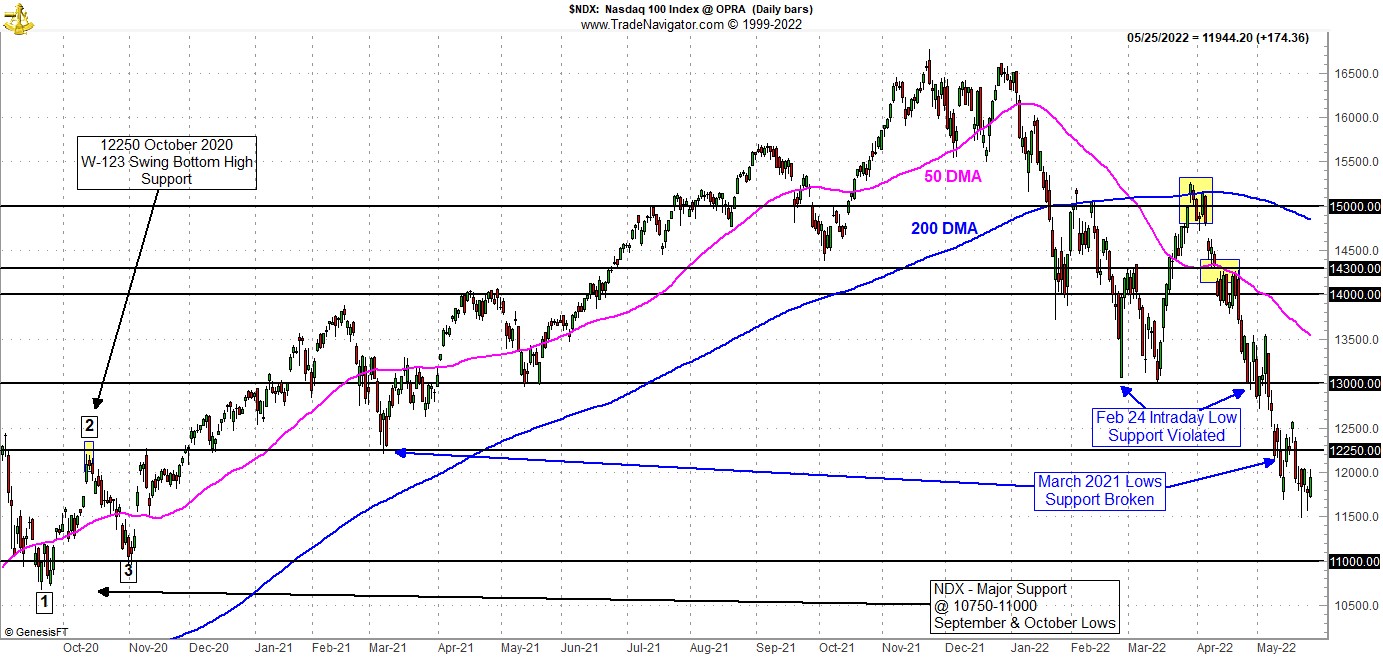
The market smashed through support at the February 24 intraday lows and now support at the March 2021 lows has been breached by NASDAQ and NASDAQ 100 (NDX), the benchmark we have been tracking of late. S&P 500 and DJIA have not broken below their respective March 2021 lows around 3750 and 31000 respectively, but they both flirted with them recently and DJIA crossed it intraday on 5/20/22.
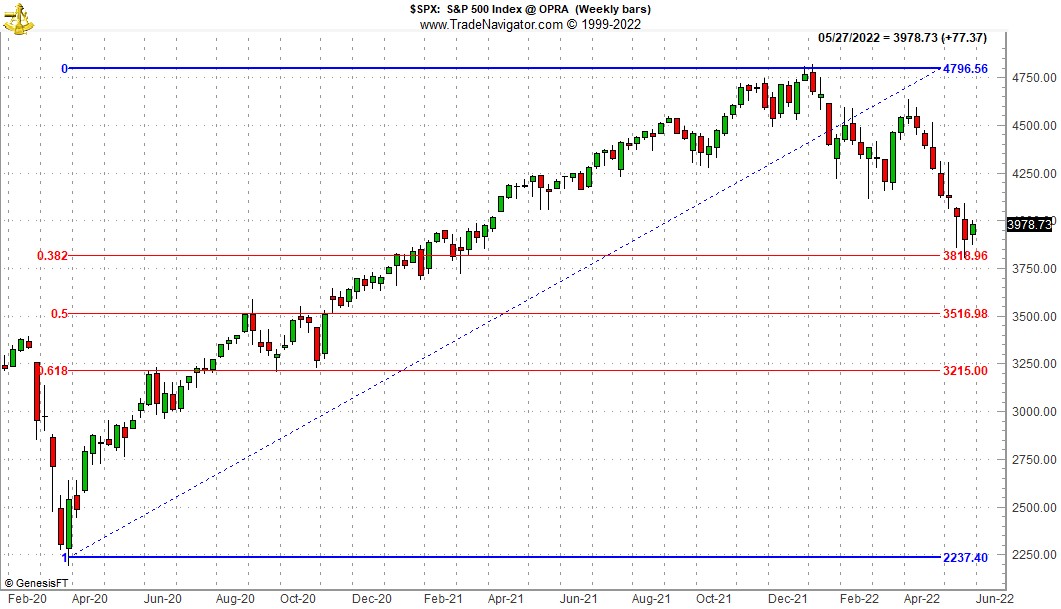
This brings support at the 2020 September/October lows into play, which is even clearer on the S&P weekly chart below. NASDAQ and NDX are practically there already. Notice how the March 2021 NDX low support also lines up with the top of the W-123 swing bottom pattern in September/October 2020.

Fibonacci Retracement Levels
S&P 500 rallied 114% from the March 2020 pandemic low to the January 4, 2022, all-time-high. Using the technical analysis Fibonacci retracement sequence shows that S&P has just about traced out the 38.2% retracement at 3800. The 50% retracement around 3500, which sits near the top of that fall-2020 swing bottom, looks in play as does the 61.8% retracement level around 3200 near the pre-pandemic highs.

Where it bottoms is anyone’s guess. We have relayed some of ours. Bottoms are not necessarily a technical level on chart or fundamental valuation, they are a perception, an exhaustion of selling. There are still too many bottom callers out there. When we start hearing, “should I sell, should I sell,” that’s more likely the bottom.
Perhaps it’s when somebody big blows up or goes bankrupt. When the market harpoons a big whale. Maybe a crypto guy, a hedge fund like Long Term Capital Management or big public company like Enron or investment bank like Lehman.
Whatever it is that creates or signals the bottom we still expect a classic midterm bottom over the next several months. It could be here in May like 1970 or it could come in October like 1962 and 1974 and so many others or somewhere in between.
Either way, patience and fortitude are in order presently. Stick to the system. Our April 7 MACD Sell Signal was fortuitous, and our stops took care of most of the rest. For now, cash is still king as we wait for that fatter pitch.


