James Stanley of DailyFX.com continues his lesson about how currency traders can take advantage of supply and demand forces in the FX market.
In our article, How Supply and Demand Affects Currency, we saw what a large impact these forces can have on prices in the Forex market. This is a strong and important relationship, but it may be difficult to understand exactly "how" this takes place.
This is where support and resistance can come into play, helping traders identify levels in which the supply and/or demand in a given currency pair may change once that line is crossed. This article will delve deeper into this premise, and we’ll look at how traders can begin to use supply and demand to their advantage.
Supply and Demand
Supply is the amount available at a particular price, while demand is the amount that is wanted or desired at a specific price.
As we saw previously, the price of a product (or instrument) can have a huge impact on the amount that is demanded from the marketplace, or the amount of supply that might be available.
As prices increase, seller’s willingness to get rid of their products will also increase. This is called a supply curve, and it illustrates how additional units become available (on the vertical axis) as prices increase (horizontal axis).
And on the other side of that equation, buyers will demand more at lower prices. As price increases, we will generally see that demand fall as illustrated below in a typical demand curve. Once again, number of units is on the vertical axis, with price on the horizontal axis:
Supply and Demand in the Real World
Let’s imagine, for a moment, that you have been tasked with the job of purchasing groceries for your family. And as most families, a top-line item on that grocery list is steak for weekend grilling.
You go to the market one day, and notice that the price on steak has doubled! It’s now going to cost twice as much to pursue your weekend grill-master activities, and you quickly begin to think how valuable that steak might be. You begin to look for alternatives, such as hamburger or chicken—replacement products from which you can derive similar value; albeit at a far more comfortable cost.
While you, individually, may decide to pay the doubled price of steak, we have to think of the market dynamics at work. Not every steak buyer would be interested in doing this, and many would opt for replacement products. This is a living example of a demand curve. As price increased, demand decreased.
But let’s say the next week you go to the grocery store, you notice a different phenomenon. Now, instead of steak being twice what you're used to paying, it’s half of what your used to paying, or 75% off of last week’s price.
Now you begin thinking in a different direction than you had last week. You start to think that having steak during the week, on top of your weekend grilling festivities, can bring some additional enjoyment to you and your family's lives. You remember how much your wife loved that steak salad the last time you took the family out for dinner, and you decide to load up while price is cheap.
But while you’re pontificating the wonders of steak in the grocery store, you witness a rush of people running with baskets full of steak. Customers are loading up while price is cheap, and you realize that if you don’t act fast, all of the discounted meat will be gone before you know it!
This is, once again, demand at work. And as price has moved lower, we’ve seen how demand increased not only for you, but the market in general.
Next: Supply and Demand Playing Out through Support and Resistance
|pagebreak|Supply and Demand Playing Out through Support and Resistance
The example of discounted steak isn’t all that different than what we can see on a currency chart. Let’s take "The Cable," for example (GBP/USD).
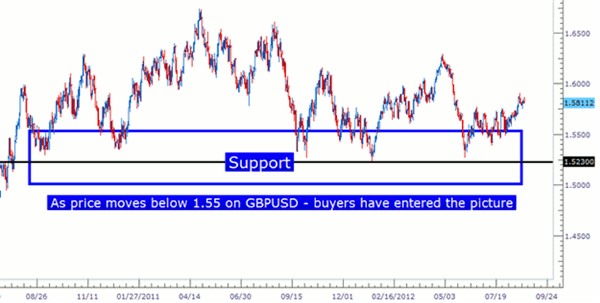
Since July 2010, we have not seen price below 1.5230. There have been multiple instances in which price has approached this level—but as of yet, this line in the sand has not been broken.
As you can see above, there have been quite a few tests of GBP/USD below 1.55 since August 2010, but as of yet there has not been a break below 1.5230. Many of these tests have been accompanied with a rise in price that eventually led to the 1.60 area on the chart.
Seeing a price below 1.55 on GBP/USD is similar to seeing steak on sale at the grocery store for 75% off. At this price level, buyers have shown a willingness to jump in because price appeared too low for them to say "no." Support is the point at which demand begins to outstrip supply, sending price higher.
Modifications to the Supply and Demand Curve
Everything that we’ve discussed thus far has been under the assumption that the environment has stayed roughly the same. And it would be fantastic if that were the case, but unfortunately this is not true. Things change, and so certainly do prices.
Let’s imagine, for a moment, that there was an outbreak of mad cow disease in your state. Now, purchasing beef appears more risky. As a matter of fact, when you go to the grocery store, you notice that steak has been marked down 75% and draws the interest of nobody in the market.
A fundamental event has just provoked a massive change in the market. This isn’t unlike an interest-rate change, or really bad data print during NFP that creates shockwaves throughout global markets.
The grocery store can continue lowering the price of steak until, eventually, some buyers feel that the risk of contracting mad cow disease is worthy of the discount they would receive on a purchase of steak. This is a breakout. And just like most breakouts, prediction of the stimuli that might cause the price change is difficult to forecast.
Trading Supply and Demand
The first thing traders need to do before placing a trade based on supply and demand is to decide whether they want to expect the environment to stay the same or to rapidly change. This is the dichotomy between the decision to trade for a range or trade for a breakout.
Next: Trading the Range
|pagebreak|Trading the Range
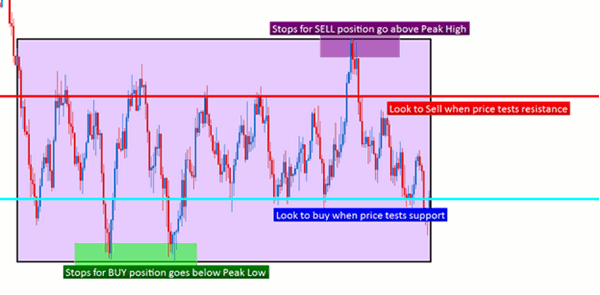
When trading a range, traders are anticipating the environment to stay about the same, with support or resistance standing its ground allowing for traders to "buy low" and "sell high."
The picture below will illustrate how a trader can use price alone to identify those points in the market at which demand begins to outstrip supply (creating increased prices) or supply begins to overrun demand (creating decreased prices):
Trading the Breakout
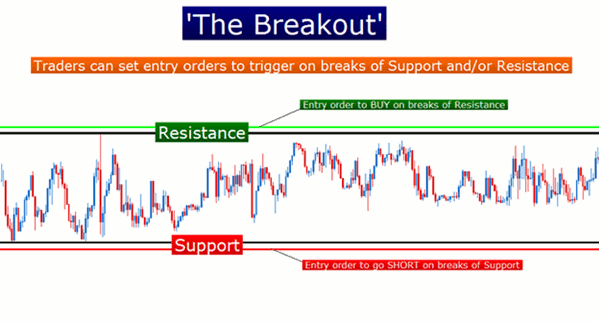
The other side of the coin is the trader that is expecting the environment to change, with breaks of support or resistance to create new highs or new lows.
With this style, the trader’s objective changes from the range-bound condition. The goal is now to "buy high, and sell back at a higher price," or to "sell low and buy back to cover at a lower price."
In the previous article, we offer an in-depth walk through for how this can be done. The picture below will illustrate how a trader can plot a breakout trade:
Since these environments can be considerably more chaotic than what might be expected in "ranging" markets, traders are usually best served by altering their money management to account for the increased risk of trading in a fast market.James Stanley is a currency trading instructor with DailyFX.com.


